
Published
The STROBE-MR checklist is the 20-item reporting standard for studies that use genetic variants as instrumental variables to estimate causal effects. Skrivankova and colleagues published it in 2021 as a statement in JAMA and as a long explanation and elaboration paper in the BMJ [1][2]. The authors encourage journals to ask for completed checklists at submission. This guide explains what each item asks, shows where each answer belongs in a manuscript, and then applies every item to a real open-access Mendelian randomization study, row by row, with a section pointer and a verdict for each.
In Simple Words
STROBE-MR is a list of 20 reporting items for Mendelian randomization papers. It asks authors to say how the genetic variants were chosen, how strong they are, where the two datasets came from, whether the samples overlap, which tests probed the assumptions, and where the data and code can be found. A reader should be able to judge the study without guessing. If an item does not apply, say so and give the reason.
What the STROBE-MR Checklist Covers
STROBE-MR is the Mendelian randomization counterpart of the STROBE guideline for observational studies, which we cover in our STROBE guide. The explanation paper walks through the 20 items with published examples of transparent reporting, and the authors keep the checklist as a living document on a dedicated website [1]. They wrote it because little consensus existed on how to report this design. Empirical work they cite found that many reports did not state or examine the Mendelian randomization assumptions and gave too little detail on their data sources [1].
A 2022 audit shows how large the gap was. Woolf and colleagues assessed 87 two-sample studies that used the MR-Base platform and found reporting generally poor, with a mean of 53% of items reported per study. Only 44% gave enough detail to judge the relevance assumption, 31% for the independence assumption and 32% for the assumptions of falsification tests, while 89% gave enough for the exclusion restriction [4]. That audit used its own bespoke checklist rather than STROBE-MR, so the percentages show what tends to go missing and are not a STROBE-MR score.
Scope matters before you open the checklist. STROBE-MR is for reports of Mendelian randomization analyses. A randomized trial follows CONSORT, and CONSORT 2025 (30 items) replaced CONSORT 2010, as our CONSORT guide explains. A conventional cohort or case-control study follows STROBE. The STROBE-MR authors also state that the checklist is not a formal tool for assessing study quality, that it should not be turned into a quality scale, and that it is not a guide for designing or conducting a study [1]. We keep that in mind when we score the example below.
STROBE-MR Checklist Items by Manuscript Section
Table 1 paraphrases the 20 items of the STROBE-MR checklist from the explanation paper [1] and groups them by the manuscript section where the answer belongs. Lettered sub-items are listed together. The right-hand column names a common way each group goes wrong, based on the wording of the items themselves.
| STROBE-MR item | Section | What to report | Common trap |
|---|---|---|---|
| 1 | Title and abstract | Name Mendelian randomization as the design when it is a main purpose of the study. | An abstract that says only genetic analysis, without naming the design. |
| 2 and 3 | Introduction | Explain the exposure, whether a causal link is plausible, why Mendelian randomization suits the question, and state the objectives with any prespecified causal hypotheses. | A rationale that never says why a trial or a cohort is not enough. |
| 4 (a to e) | Methods, data sources | For each source give the setting, the participants and sample size, whether power was calculated beforehand, how variants were measured and filtered, how exposure and outcome were assessed, and ethics approval. A table of sources is encouraged. | A dataset named only by its identifier, with no population or case definition. |
| 5 | Methods, assumptions | State the three core assumptions (relevance, independence, exclusion restriction) for the main analysis, plus any extra assumptions for sensitivity analyses. | Listing the assumptions without saying how each was examined. |
| 6 (a to e) | Methods, main analysis | Describe units and scale, how variants and weights were handled, the estimator and covariates, missing data and multiple testing. | An effect reported per unit of an unexplained scale. |
| 7 and 8 | Methods, checks | Say which methods or prior knowledge support the assumptions, and list every sensitivity or additional analysis. | An F-statistic treated as proof that the instruments are valid. |
| 9 (a and b) | Methods, software and registration | Name software, packages, versions and settings, and say whether the protocol was registered, when and where. | A package named without a version. |
| 10 (a to d) | Results, descriptive data | Report numbers at each stage, summary statistics, heterogeneity in any meta-analysed source, and for two-sample designs the similarity of variant-exposure associations and the overlap between samples. | Silence on overlap when both datasets draw on one biobank. |
| 11 (a to d) | Results, main findings | Report variant-exposure and variant-outcome associations, Mendelian randomization estimates on an interpretable scale, absolute risk where relevant, and plots. | Log-odds left unconverted and no plot of the per-variant data. |
| 12 and 13 | Results, assumption checks and sensitivity | Report the assumption checks and heterogeneity statistics, the sensitivity analyses, any test of causal direction, comparison with non-Mendelian-randomization estimates, and extra plots such as leave-one-out. | A pleiotropy test reported without any comment on its power. |
| 14 and 15 | Discussion | Summarise key results against the objectives, then discuss limitations covering the assumptions, other bias and imprecision, including the direction and size of any bias. | Limitations that list problems without saying which way they push the estimate. |
| 16 and 17 | Discussion | Interpret cautiously, discuss mechanism and gene-environment equivalence, clinical relevance, and generalisability to other populations, exposure timing and exposure levels. | Causal wording stronger than the assumptions allow. |
| 18 to 20 | Other information | Describe funding and the role of funders, give access to the data and code, and declare conflicts of interest. | Code described as available on request. |
Items 4, 6, 10 and 13 of the STROBE-MR checklist carry the most sub-items, and they are where most of the reporting effort sits. Readers who want the statistics behind them can start with our posts on weak instruments and the F-statistic, pleiotropy and the four standard estimators and the power calculation most papers omit, and the Mendelian randomization explainer covers the method end to end.
The Open-Access Example We Used for the STROBE-MR Checklist
We chose a two-sample Mendelian randomization study published in October 2026 in Endocrinology, Diabetes & Metabolism by Zaka and colleagues [3]. It asks whether genetically predicted serum 25-hydroxyvitamin D is associated with type 2 diabetes in South Asians. The authors state that the work is reported in accordance with STROBE-MR, and the PMC record lists no supplementary file, so we scored the full text, tables and figures against the STROBE-MR checklist. The article is licensed CC BY 4.0. Crossref lists the version of record under that licence, and Europe PMC and the PMC open-access record carry the same licence.
- Design. Two-sample Mendelian randomization with summary statistics from the OpenGWAS database OpenGWAS.
- Exposure. Serum 25-hydroxyvitamin D from a South Asian UK Biobank GWAS (n = 7,380), instrumented by three variants.
- Outcome. Type 2 diabetes from a meta-analysis of 16 South Asian cohorts (n = 50,533, with 16,677 cases) [5].
- Main result. Inverse-variance weighted odds ratio 1.06 (95% CI 0.83 to 1.36) per 1 SD of genetically predicted 25-hydroxyvitamin D.
Each verdict below is our reading of the article against the paraphrased item. We use four labels. Reported means the article answers the item in its own words. Judgement call means reasonable readers could differ, usually because the answer is partial or sits elsewhere. Not located in the article means we found no statement in the full text or the PDF. Not applicable means the item depends on something that summary-level data cannot supply, or on an analysis the article did not run and explains. Quotes are verbatim and short.
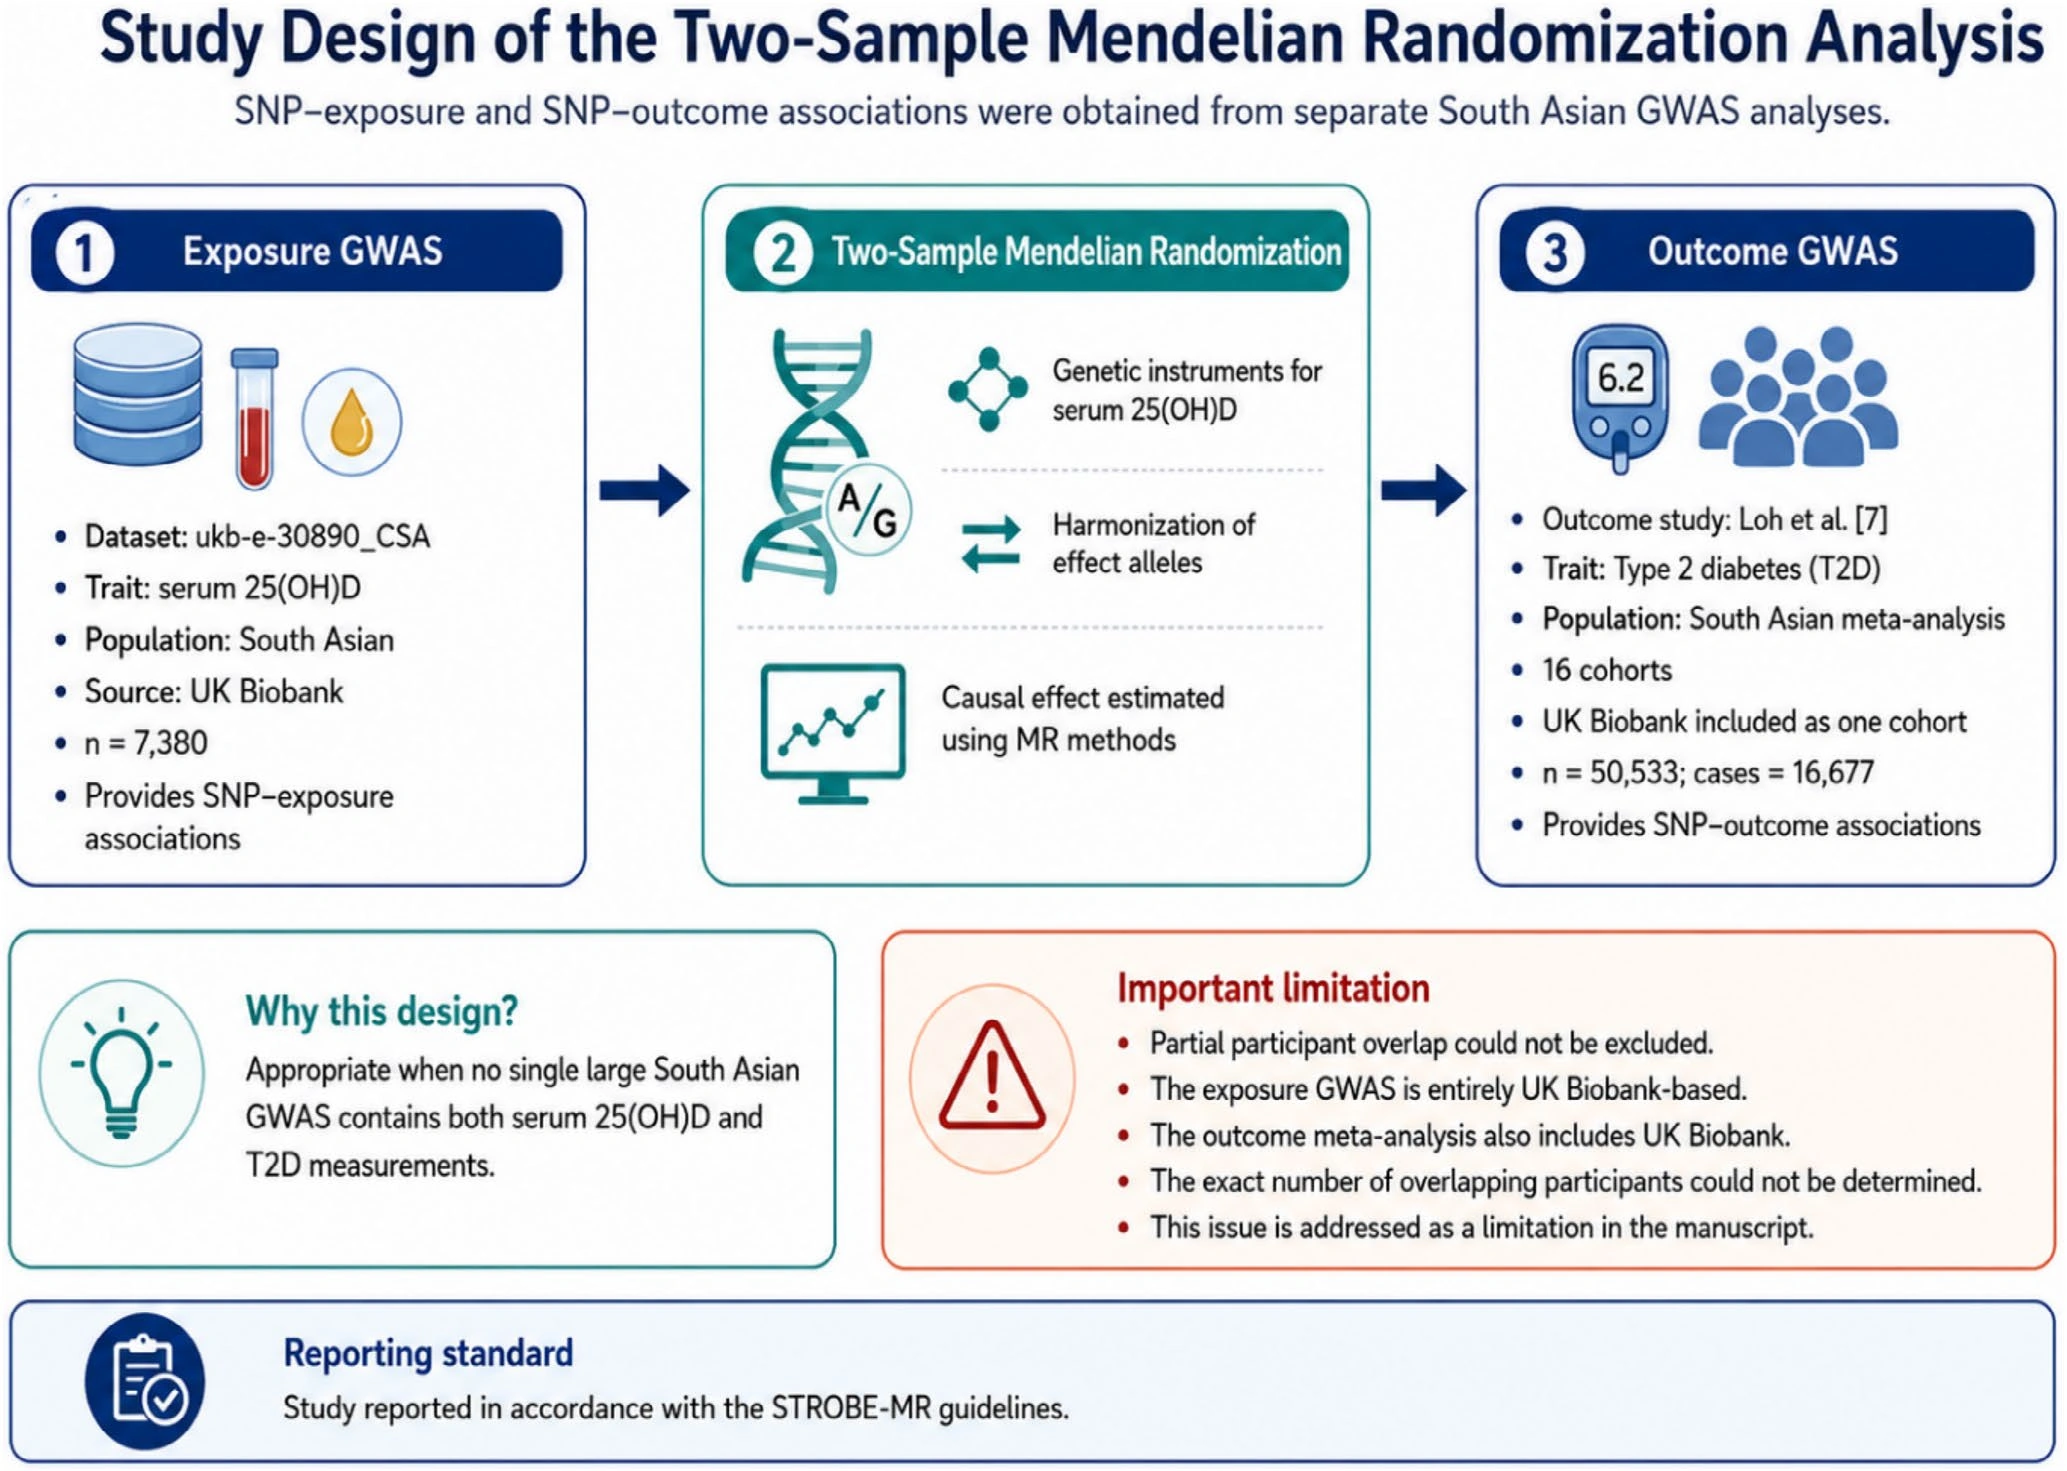
Figure 1 already answers part of item 4, because it shows both data sources, their sample sizes and the overlap concern on a single page. It is the kind of early design summary the item asks for.
STROBE-MR Checklist Applied to the Example, Item by Item
| Item | Where in the article | What the article does | Verdict |
|---|---|---|---|
| 1 | Title; Abstract | The title names the design as an “Exploratory Two-Sample Mendelian Randomization Study”, and the abstract Methods open with a two-sample analysis using OpenGWAS summary statistics. | Reported |
| 2 | Introduction | Gives the burden of vitamin D deficiency and type 2 diabetes in South Asia, a mechanism through receptors in pancreatic beta cells, the problem of confounding and reverse causation in observational data, and the case for Mendelian randomization. | Reported |
| 3 | End of Introduction | States the aim as “to evaluate the association between genetically predicted Vitamin D levels and T2D risk in South Asians”. The aim speaks of association, and no prespecified causal hypothesis is labelled as such. | Judgement call |
| 4 | Section 2.1; Table 1; Figure 2 of the article | Presents the design early, with a table of dataset identifiers, trait, ancestry and sample size, and a design diagram. | Reported |
| 4a | Sections 2.1 and 2.2 | Names the exposure GWAS (South Asian UK Biobank subset) and the outcome meta-analysis of 16 cohorts. Recruitment periods and settings of the contributing cohorts are left to the source papers. | Judgement call |
| 4b | Section 2.2; Table 1; Section 2.6 | Gives sample sizes and the type 2 diabetes case definition. The power calculation is described as post hoc, whereas the item asks whether one was done before the main analysis. | Judgement call |
| 4c | Section 2.3 | Reports the genome-wide threshold, the relaxed threshold used for two variants, clumping at r2 below 0.001 in a 10,000 kb window against a South Asian reference panel, proxy and palindromic handling, and the genome build. | Reported |
| 4d | Section 2.2 | Defines type 2 diabetes by history or treatment, fasting glucose, 2-hour glucose or HbA1c, and states the rank-normalised scale of 25-hydroxyvitamin D. The laboratory method for measuring the exposure is not described. | Judgement call |
| 4e | Section 2.2; Ethics Statement | States that the work is a secondary analysis of public summary data and that “formal ethical approval was not required”. | Reported |
| 5 | Section 2.4 | Lists relevance, exclusion restriction and independence as the three core assumptions. Assumptions behind the sensitivity estimators appear only as a note in Table 3 (at least 50% valid variants for the weighted median). | Judgement call |
| 6a | Sections 2.3 and 2.5 | Reports effects per 1 SD of the rank-normalised exposure, as log-odds converted to odds ratios. | Reported |
| 6b | Sections 2.3 and 2.5 | Treats the single genome-wide variant as a Wald-ratio instrument and the three-variant set with inverse-variance weights. | Reported |
| 6c | Section 2.5 | Names the estimators. The article does not say which covariates were used in either GWAS. | Judgement call |
| 6d | Section 2.3 | States that all three variants were available in the outcome data and no proxies were needed. It has no wider statement on missing data. | Judgement call |
| 6e | No statement found | The analysis centres on one exposure and one outcome, so the item may not bite, but the article is silent. | Judgement call |
| 7 | Sections 2.3 and 2.4 | Uses F-statistics and variance explained per variant and says “F > 10 indicates acceptable conventional instrument strength but does not by itself establish the independence or exclusion-restriction assumptions”. | Reported |
| 8 | Sections 2.5 and 3.4 | Plans MR-Egger, weighted median, simple mode and weighted mode, then adds runs at two relaxed thresholds (68 and 18 variants) and a BMI-adjusted outcome. | Reported |
| 9a | Section 2.5 | Names R 4.3.1, the TwoSampleMR package version 0.7.0 and the mRnd framework for power. | Reported |
| 9b | No statement found | No registration statement appears, although the BMI-adjusted analysis is called “pre-specified”. | Not located in the article |
| 10a | Table 1 | Summary-level data were used, so no participant flow exists. Table 1 gives the sizes. | Not applicable |
| 10b | Section 2.2; Table 1 | Gives the sample sizes and the case fraction (0.330). No mean or SD of the exposure is given. | Judgement call |
| 10c | Section 2.1 | The outcome combines 16 cohorts, and no heterogeneity statistic across them appears. The source paper may report one. | Judgement call |
| 10d (i) | Section 2.1 | Both datasets are South Asian, and the article explains why a two-sample design was needed. It does not compare variant-exposure associations across the two samples. | Judgement call |
| 10d (ii) | Section 2.1; Section 5 | States that “The exact number of overlapping UK Biobank participants could not be determined from the published report or its supplementary data”, then bounds the possible bias with a worst-case overlap proportion of 0.146. | Judgement call |
| 11a | Table 2; Figure 3 of the article | Variant-exposure effects, standard errors and p-values are in Table 2. Variant-outcome effects appear only in the scatter plot. | Judgement call |
| 11b | Section 3.3; Table 3 | Reports an odds ratio of 1.06 (95% CI 0.83 to 1.36) per 1 SD, with p = 0.630, on an interpretable scale. | Reported |
| 11c | No statement found | No translation to absolute risk, which suits a null primary estimate, but the article does not say why. | Judgement call |
| 11d | Figures 3 and 4 of the article | Provides a scatter plot with lines for each estimator and a funnel plot. No forest plot of per-variant estimates is shown. | Reported |
| 12a | Sections 3.1 and 3.2 | Reports F-statistics from 26.4 to 33.4, Q p = 0.403 and an Egger intercept p = 0.462, and adds that “a non-significant intercept should not be interpreted as reassuring evidence that horizontal pleiotropy is absent”. | Reported |
| 12b | Section 3.2; Tables 3 and 4 | Gives Cochran Q for IVW and MR-Egger in the main analysis and for IVW at the two relaxed thresholds. | Reported |
| 13a | Sections 3.4 and 3.5; Tables 3 and 4 | Reports four alternative estimators, two relaxed thresholds and the BMI-adjusted outcome. | Reported |
| 13b | Sections 3.5 and 3.6; Table 5 | Reports the BMI-adjusted analysis and power of about 18%, 51% and over 99% for odds ratios of 1.1, 1.2 and 1.5. | Reported |
| 13c | Section 2.3 | No test of causal direction was run. The article says Steiger filtering was not applied and gives its reason, which was prior biological knowledge of the instruments. | Not applicable |
| 13d | Section 4.1 | Compares the result with earlier Mendelian randomization studies and supplementation trials in words. No non-Mendelian-randomization estimate is computed. | Judgement call |
| 13e | Section 5 | Does not show a leave-one-out plot and says that MR-PRESSO and leave-one-out analyses “could not be performed with adequate precision”. | Judgement call |
| 14 | Section 4, opening paragraph | Restates the null result against the objective and notes that the MR-Egger estimate was too imprecise to corroborate it. | Reported |
| 15 | Section 5 | Lists seven limitations, and for sample overlap estimates the size of the possible bias using a bounding approach. | Reported |
| 16a | Sections 3.3, 4.1 and 6 | Interprets the null as “an absence of a detectable association within the precision afforded by current instruments” and compares it with earlier work. | Reported |
| 16b | Section 4.2 | Offers three explanations, including non-linear effects. The term gene-environment equivalence is not used. | Judgement call |
| 16c | Section 4.3 | Says that supplementation aimed at preventing type 2 diabetes is not supported by current causal evidence and that other benefits are not excluded. | Reported |
| 17 | Sections 4.2 and 5 | Notes that UK-resident participants may differ from people in Pakistan, that lifelong genetic exposure differs from time-limited trials, and that linear methods cannot detect non-linear effects. | Reported |
| 18 | No statement found | No funding statement appears in the full text or the PDF, and Crossref lists no funder for the article. | Not located in the article |
| 19 | Data Availability Statement | Gives the OpenGWAS identifiers. For code it says that the script and dataset “are being deposited in a public repository”, with the link to be added. | Judgement call |
| 20 | Conflicts of Interest | States that the authors declare no conflicts of interest. | Reported |
Across the 44 rows of the STROBE-MR checklist, 22 are Reported, 18 are Judgement calls, 2 are Not located in the article and 2 are Not applicable. The tally describes how fully the article is transparent against the paraphrased items, and it is not a quality score. Several Judgement calls come from sub-items that the checklist itself marks as conditional.
Two rows deserve a note on method. For item 4b the explanation paper asks whether a power calculation was carried out before the main analysis, and a post hoc calculation answers a different question, so we marked it a Judgement call rather than a gap. For item 19 the article gives data identifiers that anyone can follow, but its code statement is a promise, and a promise cannot be checked.
What the Numbers in the Example Show
A reporting checklist is useful partly because it lets a reader rebuild the numbers. We re-derived the headline quantities in Table 3 from values printed in the article. Where we match, the reporting is internally consistent, which is what the STROBE-MR checklist is meant to make possible. Where we differ, the item to check is the one that asks authors to state their methods and settings.
| Quantity | Our re-derivation from printed values | Article reports | Comment |
|---|---|---|---|
| F-statistic, variant rs3755967 | (0.099 / 0.017)2 = 33.9 | 33.4 | Within rounding of the displayed standard error |
| F-statistic, variant rs2459139 | (0.108 / 0.020)2 = 29.2 | 29.0 | Within rounding |
| F-statistic, variant rs72744878 | (0.101 / 0.020)2 = 25.5 | 26.4 | Within rounding, since a standard error of 0.0197 prints as 0.020 and gives 26.4 |
| Mean F-statistic | (33.4 + 29.0 + 26.4) / 3 = 29.6 | 29.6 | Match |
| Total variance explained | 0.405 + 0.342 + 0.309 = 1.056% | 1.06% | Match |
| IVW odds ratio | exp(0.058) = 1.06 | 1.06 | Match |
| IVW p-value | z = 0.058 / 0.120 = 0.483, p = 0.629 | 0.630 | Match |
| IVW 95% interval | exp(0.058 ± 1.96 × 0.120) = 0.84 to 1.34 | 0.83 to 1.36 | Judgement call. The article does not state how the interval was computed |
| Other estimator intervals | Weighted median, simple mode, weighted mode and MR-Egger | As printed | Match when recomputed from each beta and standard error |
The one difference worth a sentence is the IVW interval. The reported 0.83 to 1.36 also matches the BMI-adjusted IVW estimate (beta 0.062, standard error 0.125), whereas the primary estimate with standard error 0.120 gives 0.84 to 1.34. The gap is small, yet rounding of the printed values cannot explain it, because an interval of 0.83 to 1.36 needs a standard error near 0.126. A different interval method, such as one that inflates the standard error when heterogeneity is present, is one possible reason. Item 6 asks authors to describe the estimator and related statistics, and one clause naming the interval method would remove the question. In the limitations, the overlap passage also gives the bias as about 0.32% and as about 5.6% of the IVW estimate, so a reader has to infer which denominator each figure uses.
Four Reporting Lessons From the STROBE-MR Checklist Example
The example carries four lessons that apply to any STROBE-MR checklist you complete.
Say what you could not obtain, and size the worst case
Sample overlap is the item that most often gets one vague sentence. Here the exposure GWAS is entirely UK Biobank and the outcome meta-analysis includes UK Biobank, and the authors write that “The exact number of overlapping UK Biobank participants could not be determined from the published report or its supplementary data”. They then report that the MRlap tool failed because the covariance step returned undefined values, and substitute a bounding calculation with an assumed overlap proportion of 0.146 and phenotypic correlation of −0.12. That is the pattern item 10d asks for, namely a number where one exists and a bound where it does not.
Separate instrument strength from instrument validity
The article states that “F > 10 indicates acceptable conventional instrument strength but does not by itself establish the independence or exclusion-restriction assumptions”. The explanation paper makes a related point, that an F-statistic above 10 does not rule out weak-instrument bias, and it compares the rule of thumb to a cut-off for p-values [1]. Writing both halves of the sentence protects the paper from a reviewer who reads the F-statistic as a verdict.
Say when a diagnostic has no power
With three variants, the MR-Egger intercept has one residual degree of freedom. The authors write that “a non-significant intercept should not be interpreted as reassuring evidence that horizontal pleiotropy is absent”. A pleiotropy test reported without that sentence invites the reading that the study is clean. Our post on what each pleiotropy estimator protects against explains why the number of variants limits each method.
Close the loop between Methods, Limitations and the reference list
Four details in the published article would draw a copy editor’s query. Section 2.3 says Steiger directionality filtering was not applied, yet Section 5 says its details “should be confirmed and reported in the final Methods”, which reads like a drafting note. The Data Availability Statement promises a repository link that is not yet in the text. The design figure (our Figure 1) cites the outcome study as reference 7, whereas the reference list gives it as 9, and reference 7 is a review by Davey Smith and Hemani. The overlap-bounding approach is credited to Burgess and colleagues as reference 11, and the list shows reference 11 as the MR-Egger interpretation paper by Burgess and Thompson. None of this changes the findings. All of it is fixable in a final read of the proofs, which is why we advise checking every placeholder and citation number against the checklist before submission.
How to Complete Your Own STROBE-MR Checklist
The STROBE-MR checklist works best when it is filled in while the manuscript is written, not after a reviewer asks. The steps below follow the order in which the answers usually become available.
- Download the checklist from the STROBE-MR website or from the explanation paper [1], and add a column for the page or section where each answer sits.
- Build a data-source table early in Methods, with dataset identifiers, trait, ancestry, sample size, case numbers and genome build, as the example does in its Table 1.
- Write the overlap sentence even when overlap is zero. If you cannot count it, state a bound.
- Report F-statistics and variance explained per variant, then add a power statement for the effect size that matters.
- State the registration status, including a plain statement of no registration when that is the case, since item 9b asks for a statement either way.
- Deposit the code and the harmonised dataset before submission, and replace every placeholder with a link.
- For rows that do not apply, write a one-line reason in the row instead of leaving it blank.
- Say in the Methods that the study followed STROBE-MR, and attach the completed checklist if the journal asks. Our manuscript submission checklist lists the other files editors expect.
Common Mistakes When Reporting a Mendelian Randomization Study
These are the slips we expect to see most often when a STROBE-MR checklist is completed late, and each maps to a specific item.
- Naming datasets without describing them. Item 4 wants the population, dates, sample size and case definition for each source.
- Reporting only the primary estimator. Items 8 and 13 want every sensitivity analysis, including the ones that disagree.
- Leaving out registration status. Item 9b asks for a statement either way.
- Using causal language the assumptions cannot carry. Item 16 asks authors to say that estimates are causal only under stated assumptions.
- Promising code. Item 19 wants the code or its location, and a future link is not a location.
Frequently Asked Questions About the STROBE-MR Checklist
How many items does the STROBE-MR checklist have?
The STROBE-MR checklist has 20 items, and several of them carry lettered sub-items, so a completed form has more than 20 rows [1].
Does STROBE-MR replace the STROBE checklist?
For a Mendelian randomization report, STROBE-MR is the guideline to follow. For a conventional observational study, use STROBE, which our STROBE tutorial covers.
Should STROBE-MR be used to score the quality of a published study?
No. The authors state that the STROBE-MR checklist should not be turned into a quality scale, and that it exists to make appraisal possible rather than to perform it [1].
Is a power calculation needed to satisfy item 4b?
Item 4b of the STROBE-MR checklist asks authors to report the sample size and whether any power or sample size calculation was carried out before the main analysis. A statement that none was done is a valid answer, and a post hoc calculation should be labelled as such, as the example does.
Free Research Tools from Editverse
- GraphPro: build publication-ready charts, 25 types, with built-in t-test, ANOVA, correlation, and chi-square p-values. Free, no signup.
- StatPro: free statistical calculators and a test-selector tool covering group comparisons, categorical outcomes, time-to-event analysis, and diagnostic accuracy.
- Flowchart Pro: generate PRISMA 2020, PRISMA-ScR, CONSORT, STROBE, STARD, MOOSE, and ARRIVE flow diagrams directly in your browser.
Professional Support for a Mendelian Randomization Manuscript
A checklist can only record what the analysis already contains. Whether you are planning the analysis or preparing to complete the STROBE-MR checklist, Editverse supports authors at both stages, and our work follows COPE, ICMJE and GPP 2022 guidance, with institutional and country-specific ethics requirements observed. The full study package below includes a completed STROBE-MR checklist.
Before you commit
$450
A senior analyst checks whether your question is already answered, whether the data can support it, and whether you have the power, including instrument strength for a Mendelian randomization design. Credited in full against any study you commission. 5 business days.
Full study
$2,900
Two-sample Mendelian randomization from public GWAS summary statistics, with instrument strength, Steiger filtering, four estimators that probe pleiotropy, MR-PRESSO, manuscript, plots, runnable TwoSampleMR code and a STROBE-MR checklist. 15 business days.
Send us your draft and the journal you are targeting, and we will say which of the two fits where you are.
Conclusion
The STROBE-MR checklist turns a Mendelian randomization paper from a set of results into something a reader can audit. Applied to a real open-access study, it shows what good reporting looks like, with quantified worst cases, honest notes on low-powered tests and a design diagram on the first page of Methods, and it shows where even a careful paper leaves gaps, namely registration, funding, covariates and code. Complete the checklist before submission, write a reason in every row that does not apply, and check every placeholder and citation number in the final proofs.
References
- Skrivankova VW, Richmond RC, Woolf BAR, Davies NM, Swanson SA, VanderWeele TJ, et al. Strengthening the reporting of observational studies in epidemiology using mendelian randomisation (STROBE-MR) explanation and elaboration. BMJ. 2021;375:n2233. doi:10.1136/bmj.n2233. PMID 34702754. PMC8546498.
- Skrivankova VW, Richmond RC, Woolf BAR, Yarmolinsky J, Davies NM, Swanson SA, et al. Strengthening the reporting of observational studies in epidemiology using Mendelian randomization. The STROBE-MR statement. JAMA. 2021;326(16):1614-1621. doi:10.1001/jama.2021.18236. PMID 34698778.
- Zaka A, Khan S, Shah A, Khalid AA, Khalil I, Kamrul-Hasan ABM. Association between genetically predicted 25-hydroxyvitamin D and type 2 diabetes risk in South Asians. An exploratory two-sample Mendelian randomization study. Endocrinol Diabetes Metab. 2026;9(6):e70359. doi:10.1002/edm2.70359. PMID 42912852. PMCID PMC13690357. Licence CC BY 4.0.
- Woolf B, Di Cara N, Moreno-Stokoe C, Skrivankova V, Drax K, Higgins JPT, et al. Investigating the transparency of reporting in two-sample summary data Mendelian randomization studies using the MR-Base platform. Int J Epidemiol. 2022;51(6):1943-1956. doi:10.1093/ije/dyac074. PMID 35383846. PMC9749715.
- Loh M, Zhang W, Ng HK, Schmid K, Lamri A, Tong L, et al. Identification of genetic effects underlying type 2 diabetes in South Asian and European populations. Commun Biol. 2022;5:329. doi:10.1038/s42003-022-03248-5. PMID 35393509.
Guideline wording is paraphrased from the STROBE-MR explanation paper, which is published under CC BY 4.0. The ICMJE recommendations are available at icmje.org.