Cover image: ROC curve, Bland-Altman plot, Kaplan-Meier curve and funnel plot, clinical research graphs

Clinical Research Graphs: 10 Plots for Trials, Diagnostic Tests and Meta-Analysis

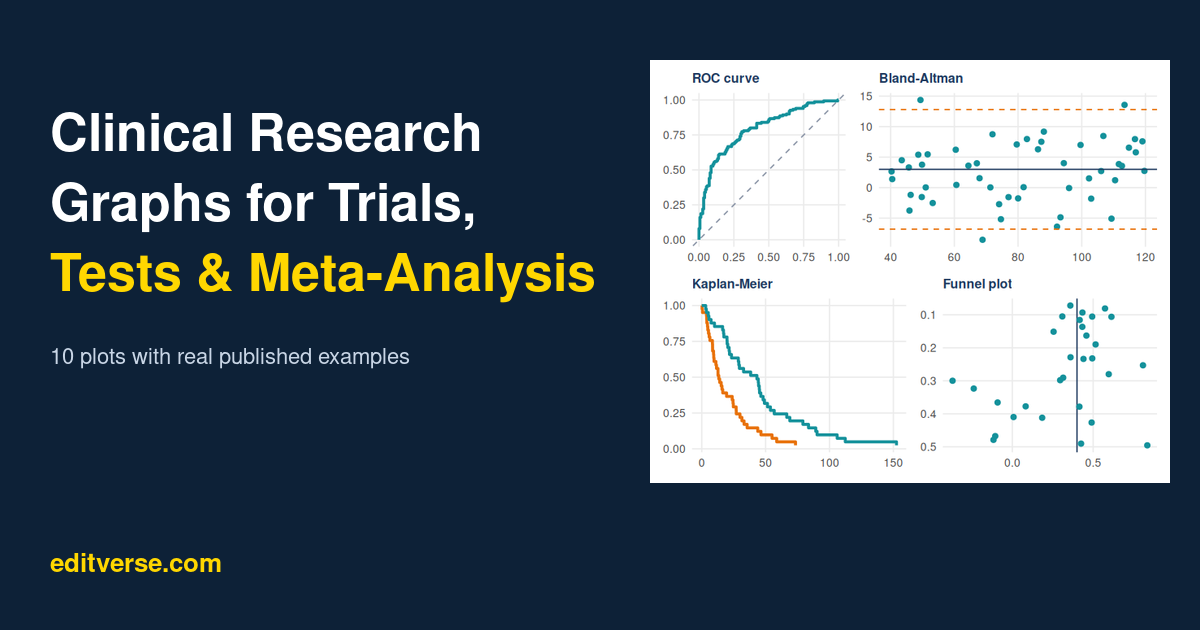
Reviewers read your figures before they read your methods. The clinical research graphs that survive peer review share one trait: each one answers a single question, and the reader can see the answer in under ten seconds. This guide covers the 10 plots a clinical researcher meets most often, from the CONSORT flow diagram to the heatmap. For each one you get a real published…
Missing Physiologic Data in NTDB and TQP: How Much Complete-Case Analysis Actually Biases Trauma Mortality

Complete-case analysis is the quiet default in trauma registry research. Drop the rows with a missing GCS, blood pressure, or respiratory rate, fit the model on whatever is left, and report the result. A 2018 systematic review of 539 trauma registry manuscripts found that more than half either never mentioned data completeness or mentioned missing data without saying how it was handled, which means complete-case…

NTDB and TQP Trauma Registry Data Explained: What It Can Answer, What It Cannot, and How to Analyse It

The National Trauma Data Bank and its successor, the American College of Surgeons Trauma Quality Programs participant use file, now draw on more than 900 participating trauma centres across the United States. Scale gets treated as a substitute for rigour more often than it should. A 2018 systematic review of 539 trauma registry manuscripts published between January 2015 and March 2017 found that 38.6% never…

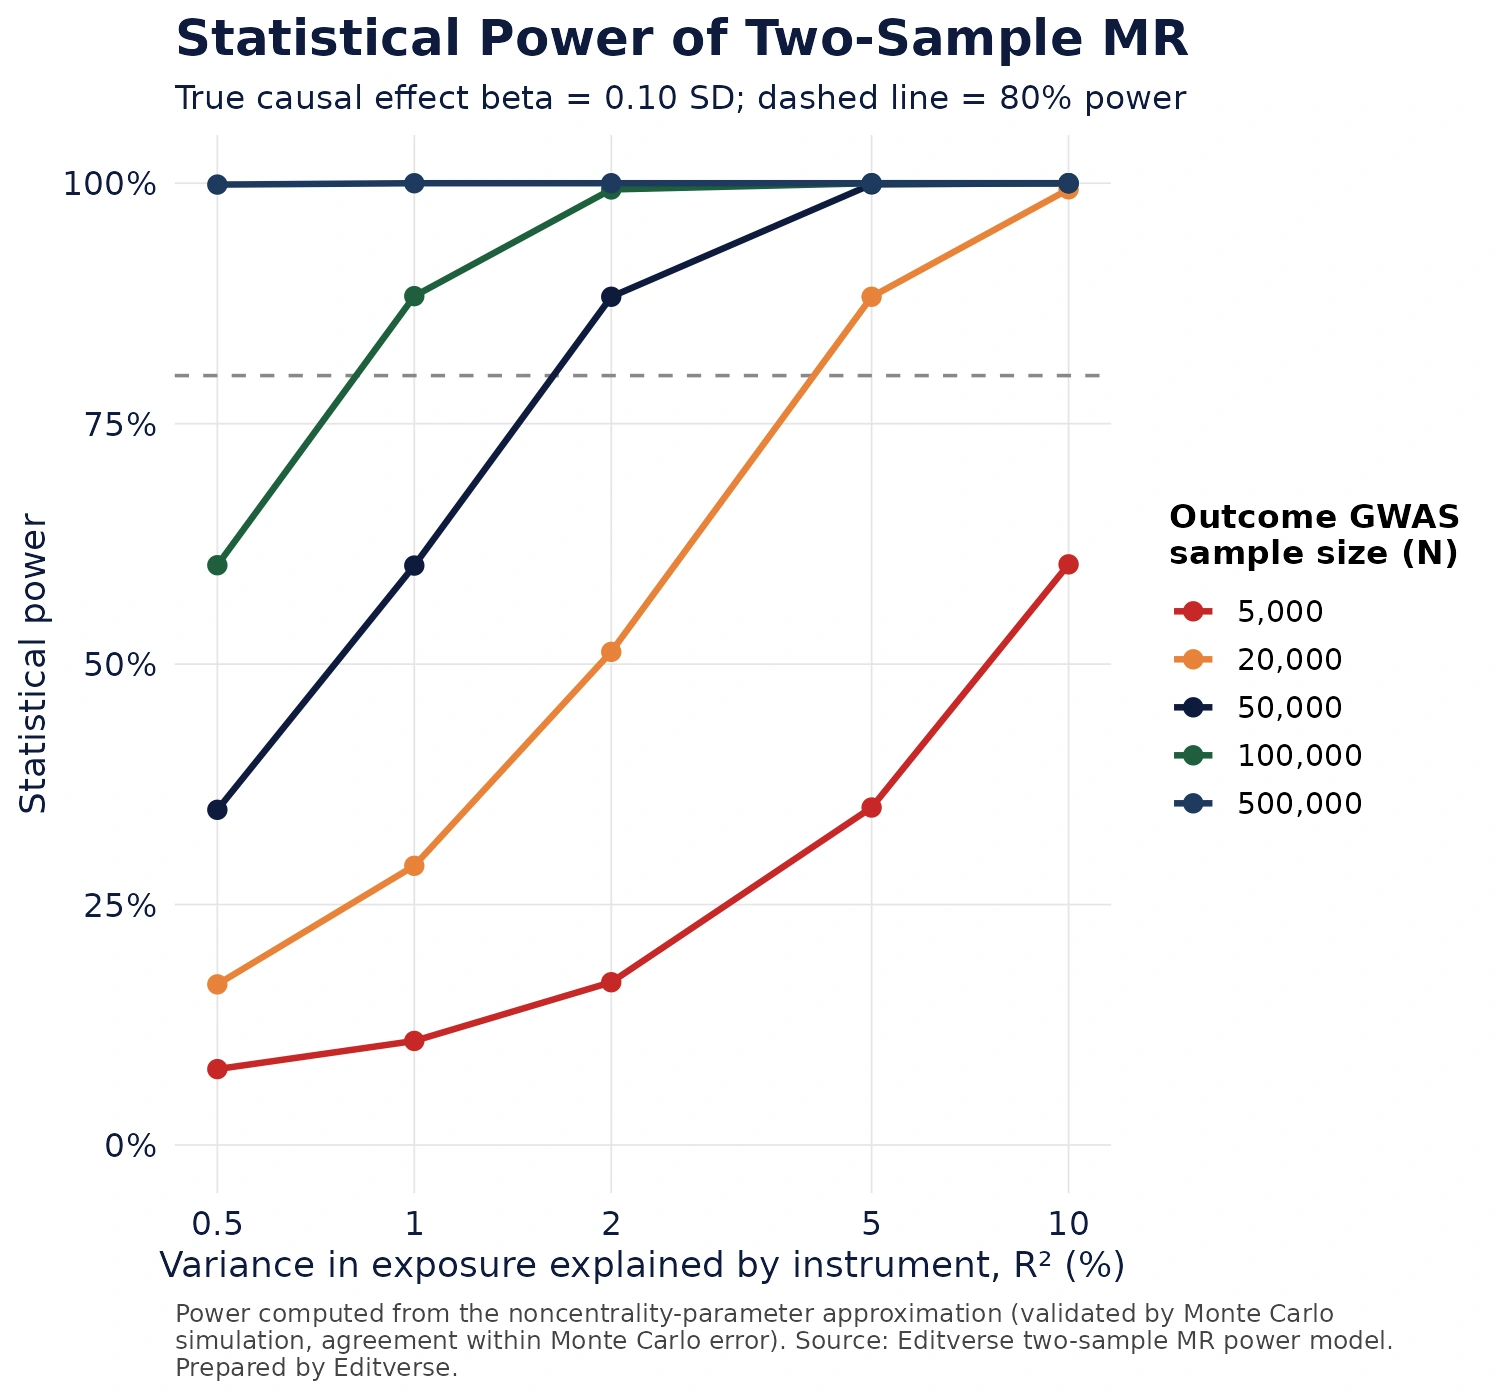
Statistical power of two-sample Mendelian randomization rising with outcome sample size and instrument R-squared, true effect 0.10 SD

Why Mendelian Randomization Papers Get Desk-Rejected: The Power Calculation Almost Nobody Reports

A Mendelian randomization power calculation is the one step in the whole pipeline that costs nothing to run and gets skipped anyway. Rosas-Chavez and Merriman audited 86 two-sample MR studies of hyperuricaemia and gout published between 2016 and 2024 and found that 59 percent addressed power at all, which means 41 percent reported a causal estimate, positive or null, with no statement of whether the…

Competing Risks in Cancer Registry Studies: Kaplan-Meier Overstates, Fine-Gray Answers a Different Question

Competing risks are the reason a survival curve in an older cancer cohort can be confidently, reproducibly wrong. When a seventy-eight-year-old with a slow-growing tumour dies of heart failure, that death does not censor the cancer outcome. That death removes the possibility of the cancer outcome forever. Kaplan-Meier cannot represent that, because censoring in Kaplan-Meier means “we stopped watching”, not “this can no longer happen”.…