
Published
The ARRIVE 2.0 checklist has 21 items, and ten of them decide whether a reviewer can trust an animal study at all. Those ten, called the Essential 10, cover the study design, sample size, exclusions, randomisation, blinding, outcomes, statistics, animals, procedures and results. This guide applies every one of them to a real open-access rat study, names the section where each answer sits, and marks the rows that need a judgement call.
The guideline was published by Percie du Sert and colleagues in PLOS Biology in 2020, with an explanation and elaboration paper that gives the reasoning for each item. Both are released under a CC0 public domain dedication, so the wording can be reused freely. We still paraphrase the items and quote the example article sparingly. The official home of the guideline is the ARRIVE website, and the checklist is also listed on the EQUATOR Network page for ARRIVE. This page covers the Essential 10 only.
In Simple Words
The ARRIVE 2.0 checklist is the reporting checklist for studies that use live animals. It tells authors what a reader must be able to find in a manuscript, such as how many animals went into each group, how they were allocated, who knew which group was which, and what was measured. The Essential 10 is the minimum. Below, each of the ten is checked against one published rat study, so you can see what a clear answer looks like and where careful authors still leave gaps.
What changed in the ARRIVE 2.0 checklist
The original ARRIVE guidelines appeared in 2010 as a single list. The 2020 revision sorts the items into two groups. The Essential 10 is, in the authors’ words, “the basic minimum to include in a manuscript”. The Recommended Set of 11 items adds context, such as the ethical statement, housing and husbandry, animal care and monitoring, protocol registration, data access and the declaration of interests. Three topics are new in version 2.0, namely inclusion and exclusion criteria, protocol registration and data access.
The revision was needed because the older list was endorsed but not followed. The ARRIVE 2.0 paper reports that surveys of published studies found randomisation described in only 30 to 40 percent of papers, blinding in about 20 percent, sample size justification in under 10 percent and basic animal characteristics in under 10 percent. The surveys include work by Macleod and colleagues in 2015 and by Avey and colleagues in 2016. A randomised trial run on PLOS ONE submissions found that asking authors for a completed ARRIVE checklist at submission did not improve what appeared in the published papers. A ticked box is therefore not a check, and a worked example with section pointers is a better teaching tool than the checklist alone.
The stakes are scientific as well as editorial. The explanation and elaboration paper notes that studies without bias-reducing steps such as randomisation and blinding can show effect sizes inflated by as much as 30 to 45 percent. If you report a clinical trial instead of an animal study, use our CONSORT guide and, for the protocol, the SPIRIT guide. Systematic reviews follow our PRISMA 2020 guide, and diagnostic work is covered in our STARD vs TRIPOD guide. A separate risk-of-bias tool for pooling animal studies, SYRCLE, is covered in our SYRCLE risk of bias tool guide and is not covered here.
| Item | Name | What the reader must be able to find |
|---|---|---|
| 1 | Study design | The groups compared, any control group, and the experimental unit. |
| 2 | Sample size | Exact n per group and in total, and how n was decided. |
| 3 | Inclusion and exclusion criteria | Rules for dropping animals or data, what was dropped, and the exact n behind each analysis. |
| 4 | Randomisation | Whether animals were randomly allocated, how the sequence was made, and how confounders such as cage position were handled. |
| 5 | Blinding | Who knew the allocation at allocation, conduct, outcome assessment and analysis. |
| 6 | Outcome measures | Every outcome defined, and the primary outcome that set the sample size. |
| 7 | Statistical methods | Each test and the software, and the checks that assumptions were met. |
| 8 | Experimental animals | Species, strain, sex, age, weight, source, health status, genetics and earlier procedures. |
| 9 | Experimental procedures | What, how, when, where and why, in enough detail to repeat the work. |
| 10 | Results | Summary statistics with variability for each group, and the effect size with a confidence interval. |
How the example article was chosen and checked
We searched PubMed and Europe PMC for rodent studies in PLOS journals that state adherence to ARRIVE, describe randomisation and blinding, and offer full text without a paywall. We kept one whose licence we could confirm three ways. Crossref lists the version of record under CC BY 4.0, Europe PMC flags the article as CC BY, and the licence statement inside the full-text XML names the Creative Commons Attribution License. The article also ships its own ARRIVE 2.0 author checklist as a supplementary file, which let us compare our reading with the authors’ page mapping.
Each row below carries the section where the answer sits, the evidence in the article, and a call. Reported means the item is answered where the checklist expects it. Partly reported means some of the item is answered and a named part is missing. Judgement call means two careful readers could score the row differently. Not reported means we could not find the answer. Every quotation is 25 words or fewer, sits in quotation marks and was checked against the full text. This is a reporting check, so we did not re-analyse the data or assess the authors’ conclusions.
The rat study behind this worked example
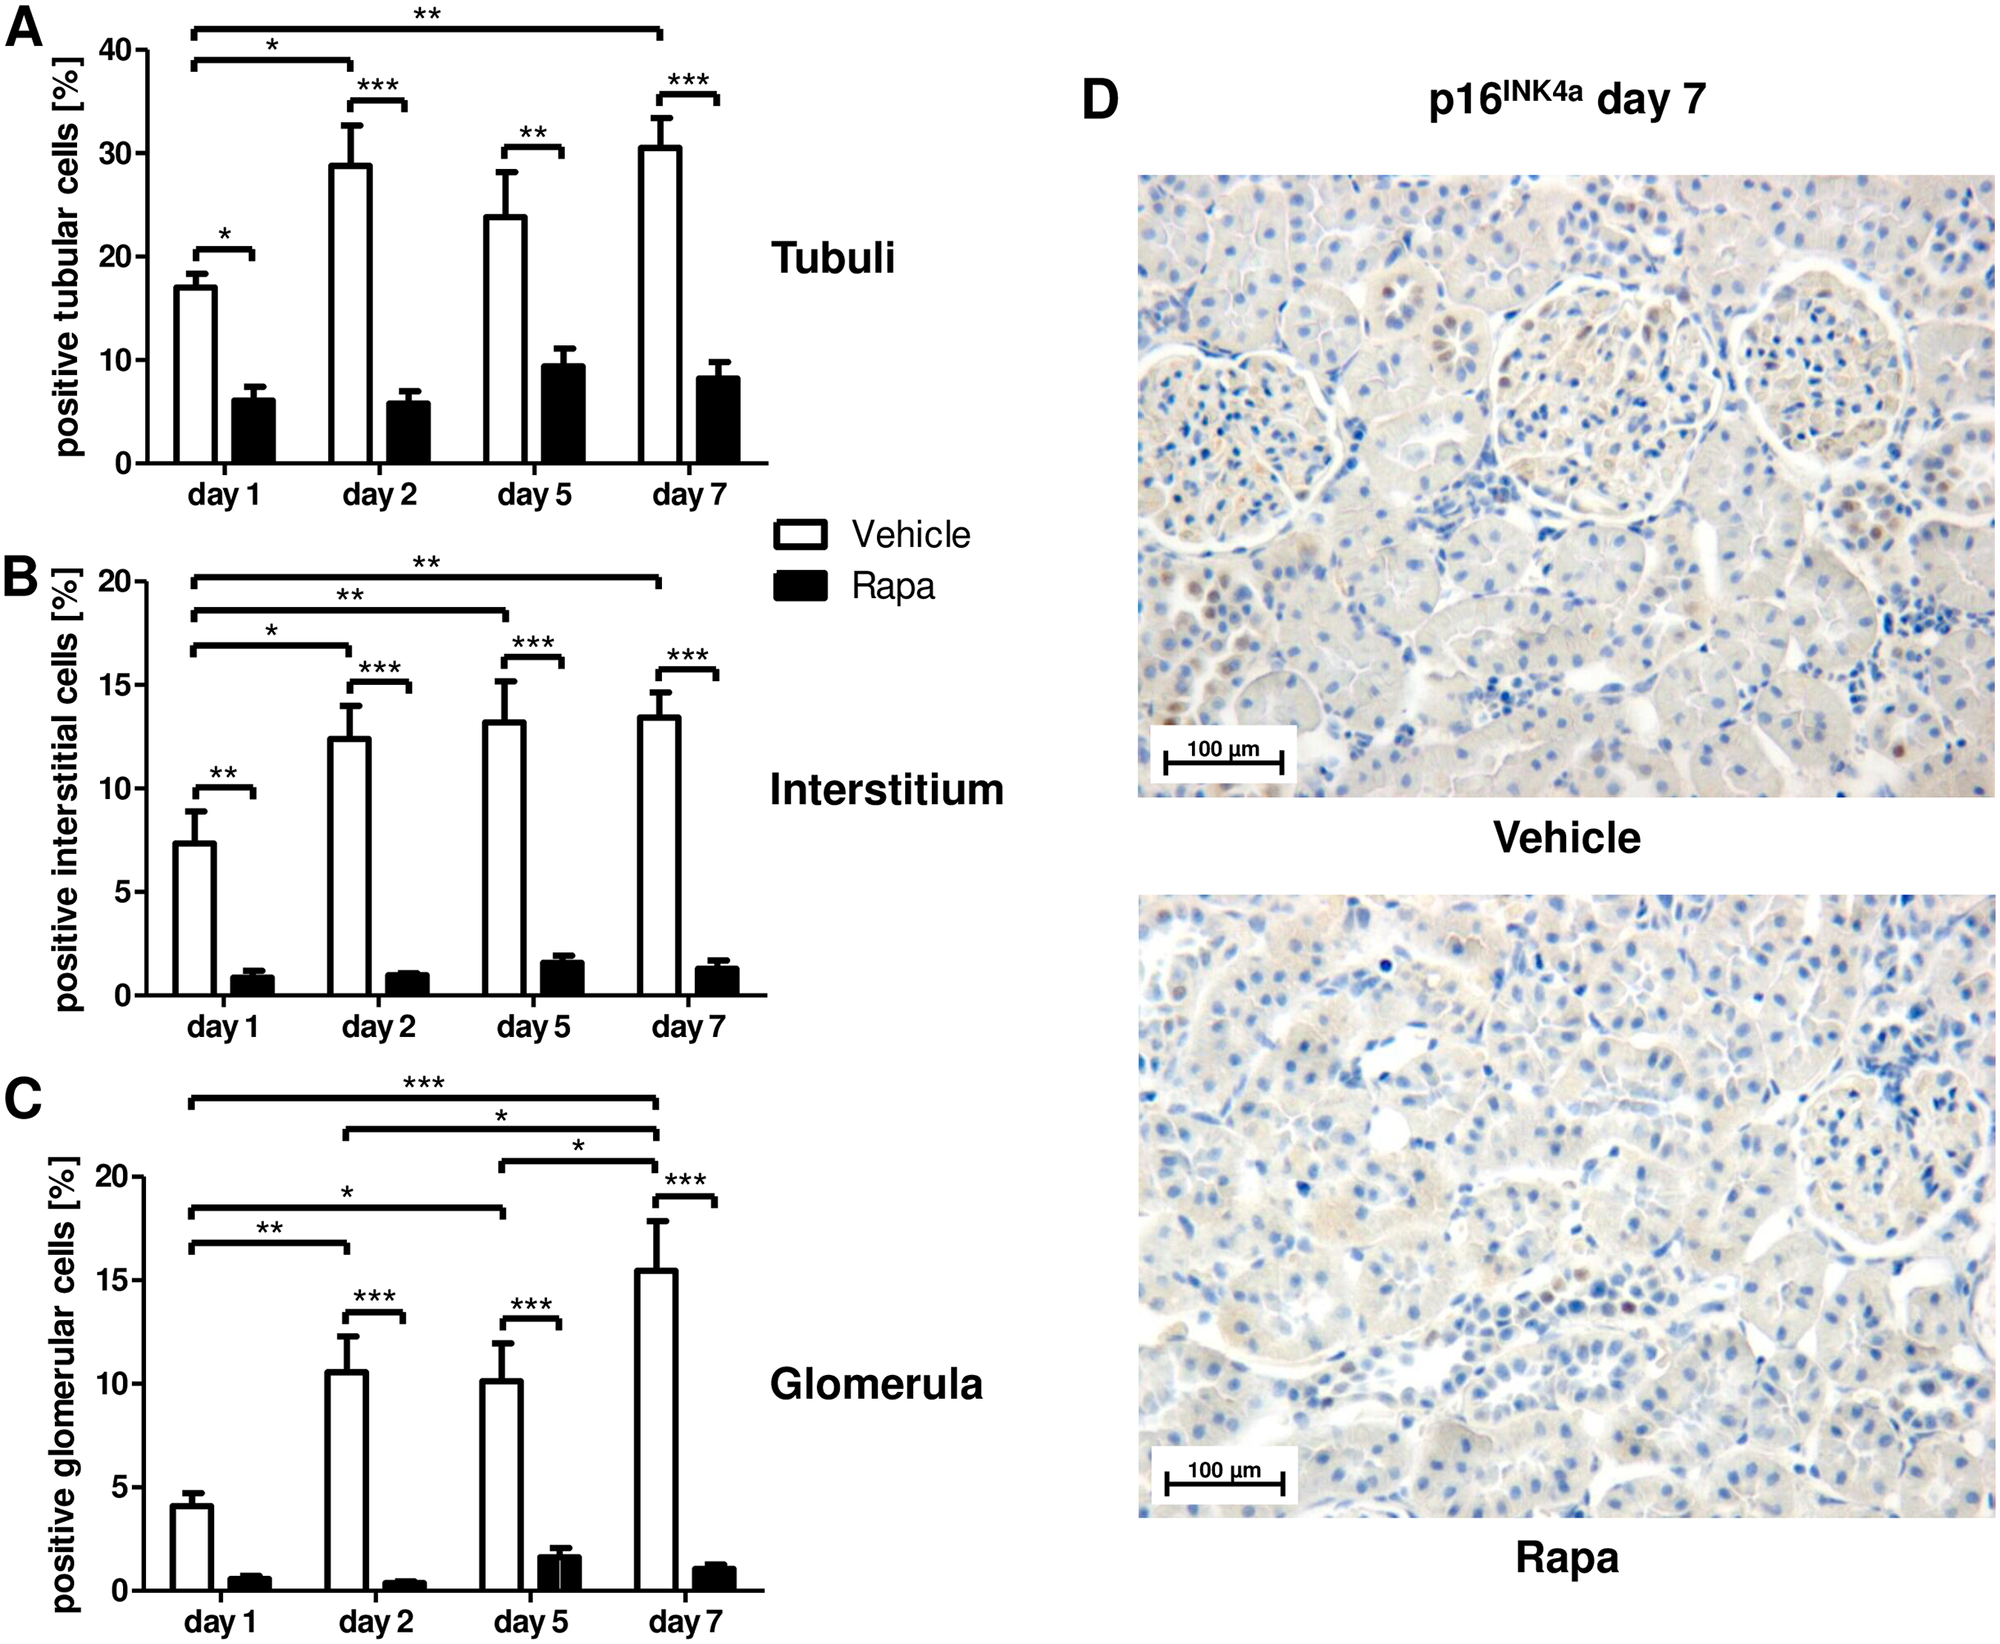
The article is “The mTOR inhibitor Rapamycin protects from premature cellular senescence early after experimental kidney transplantation” by Hoff and colleagues, published in PLOS One in April 2022. The team transplanted kidneys from Fischer rats into Lewis rats and gave the recipients either low-dose rapamycin (Rapa) or water by gavage. They then counted senescent cells, measured inflammatory markers and kidney function, and killed groups of animals on days 1, 2, 5 and 7. According to the abstract, low Rapa trough levels of 2.1 to 6.8 ng/mL prevented the accumulation of p16INK4a positive cells in tubules, interstitium and glomerula.
In the Methods, the authors write “we followed the guidelines of the American Physiological Society as well as the ARRIVE guidelines”. The text does not name a version, but the supplementary author checklist is headed ARRIVE 2.0. The article suits a worked example because it is a surgical model with a clear control, several outcomes and a fully stated analysis, so every Essential 10 row has something to test. It is also typical of careful laboratory reporting, which means the gaps we find are the common ones.
Items 1 to 3 (study design, sample size, exclusions)
These three items describe what went into the study and what came out of it. The explanation and elaboration paper points out that the number of units at the start can differ from the n in the analysis, and that readers use the gap to spot attrition. For that reason the checklist asks for the allocated number and, separately, the exact n behind every analysis.
| Item | What it asks | Where in the article | Evidence | Call |
|---|---|---|---|---|
| 1a | Groups compared, including control groups, or a reason for having no control. | Methods, Animals and surgical procedures; Results, first paragraph | Rats were assigned to a vehicle group (19) or a Rapa group (21), and vehicle rats received an equivalent amount of water by gavage, so the comparator is explicit. Each rat was killed on day 1, 2, 5 or 7, which makes a two by four layout that is described in words only. The explanation and elaboration paper recommends a timeline diagram for designs of this kind. | Reported |
| 1b | The experimental unit, such as an animal, a litter or a cage. | Methods, Animals and surgical procedures | “In total, 40 animals were used as experimental units.” The unit is named outright, which many papers leave to the reader. | Reported |
| 2a | Exact number of units per group and in total, plus the total number of animals used. | Methods, Animals and surgical procedures | Allocation was 19 vehicle and 21 Rapa rats, split by sacrifice day as 5, 5, 5 and 4 for vehicle and 6, 6, 4 and 5 for Rapa. The groups sum to 19 and 21, and together to 40. The article does not say how many donor rats supplied the grafts, so the total number of animals used is not stated. | Partly reported |
| 2b | How the sample size was decided, with details of any a priori calculation. | Methods, Animals and surgical procedures | “The sample size was estimated from previous studies with the same and similar models by our group”. The basis is stated, but there is no effect size, variability estimate or power, so a reader cannot judge whether the groups could detect a difference. The item asks for calculation details only if one was done. | Judgement call |
| 3a | Criteria for including or excluding animals and data points, and whether they were set in advance. | Methods, Animals and surgical procedures, closing paragraph | “All technically valid data points were included in the analyses.” This implies a validity rule, but the rule is not defined and nothing says it was fixed before data collection. | Judgement call |
| 3b | Animals, units or data points left out of the analysis for each group, with reasons, or a statement of none. | Methods, Animals and surgical procedures, closing paragraph | “No animals were excluded from the study.” The Methods also state “Survival until the planned endpoint was 100%.” | Reported |
| 3c | The exact n in each group for each analysis. | Figure legends | Legends give n as a range, for example 3 to 6 in Fig 1 and 3 in Fig 3A, without saying whether the figure is per group or per day. Fig 3C gives 6 to 8 for day 7 although only 4 vehicle and 5 Rapa animals were killed that day, so its unit is not the animal. Allocation was 4 to 6 per group and day, and the text does not explain the gap between allocated and analysed numbers. | Partly reported |
The article does well on the unit and the groups. It names the animal as the experimental unit, gives the allocation per group and per day, and reports no exclusions. The two weaker rows are connected. Without a stated calculation, a reader cannot tell whether four or five animals per cell were enough, and without a per-group n in each legend, a reader cannot tell whether the smaller numbers in some figures reflect unusable samples or a subset of animals. A single sentence per figure, such as “n = 4 vehicle and 5 Rapa on day 7”, would close row 3c.
ARRIVE 2.0 checklist items 4 to 6 (randomisation, blinding, outcomes)
These items protect against bias. Randomisation limits selection bias at allocation, and blinding limits it during treatment, scoring and analysis. The explanation and elaboration paper states that “Selecting an animal ‘at random’ (i.e., haphazardly or arbitrarily) from a cage is not statistically random”. Blinding does not have to cover every stage, but each stage should be accounted for, which is why the checklist asks about four of them.
| Item | What it asks | Where in the article | Evidence | Call |
|---|---|---|---|---|
| 4a | Whether randomisation was used and how the sequence was generated. | Methods, Animals and surgical procedures | “They were randomly allocated to the treatment groups without any specific randomization protocol.” Randomisation is stated, but the method is not. The explanation and elaboration paper explains that picking an animal at will from a cage is not statistically random, so a reader cannot tell which kind was used. | Partly reported |
| 4b | The strategy used to limit confounders such as treatment order and cage location. | Methods, Animals and surgical procedures | “The order of treatments, duration of observation periods, and cage location was evenly distributed across the whole study.” This is a clear statement of intent. How the balance was achieved is not described. | Reported |
| 5 | Who knew the group allocation at allocation, conduct, outcome assessment and analysis. | Methods, Animals and surgical procedures; Methods, Histology | “The following analyses were performed in a blinded manner after organ harvesting.” The histology section adds that fields were counted “by a blinded observer”. Outcome assessment is covered for those analyses. The article does not say who knew the allocation during allocation, treatment or data analysis. | Partly reported |
| 6a | Every outcome measure defined. | Methods, Histology, Quantitative real-time PCR; Results | Senescent cells (p16INK4a positive nuclei by kidney compartment), cytokine mRNA, macrophage and T cell markers, the AKI score, creatinine clearance, proteinuria, sodium excretion, blood glucose and body weight are each defined in Methods or Results and reported. | Reported |
| 6b | The primary outcome, meaning the one that set the sample size, for hypothesis testing studies. | Introduction, last paragraph; Methods | The stated hypothesis is that Rapa reduces cellular senescence in the graft, which points to p16INK4a, but no outcome is named as primary and none determined the sample size. The authors’ own checklist marks this row as not applicable. | Not reported |
Row 5 shows how a blinding statement can be accurate and still incomplete. The histology counts and the post-harvest analyses were blinded. Administering a drug by gavage against water by gavage is difficult to blind, which is a reason to say so and to describe who gave which treatment. Row 6b is the other common gap. A study that tests a hypothesis should say which outcome carried the sample size, even when the sample size came from earlier experiments.
ARRIVE 2.0 checklist items 7 to 10 (statistics, animals, procedures, results)
The last four items let a reader repeat the work and judge the size of the effect. Procedures are where this article is strongest, and statistics and effect sizes are where it is thinnest.
| Item | What it asks | Where in the article | Evidence | Call |
|---|---|---|---|---|
| 7a | The statistical method for each analysis, with the software. | Methods, Statistical analysis | “All results are expressed as means ± SEM.” Two way analysis of variance with Bonferroni’s multiple comparisons test was used for treatment and time point, with a two sided P value below 0.05 and GraphPad Prism 5.0. | Reported |
| 7b | How the data were checked against the assumptions of the test, and what was done if they failed. | Methods, Statistical analysis | The paragraph names the test but describes no check of distribution or variance and no fallback. The authors’ checklist points to this same paragraph. | Not reported |
| 8a | Species, strain and substrain, sex, age or stage, and weight. | Methods, first paragraph | Male inbred Fischer (F344) and Lewis (Lew, RT1) rats, 10 weeks old and 190 to 300 g, are named, with the supplier and city. | Reported |
| 8b | Provenance, health or immune status, genetic modification, genotype and previous procedures. | Methods, first paragraph | The supplier is given. Health or pathogen status and any earlier procedures are not stated, and the article does not mention genetic modification. | Partly reported |
| 9a | What was done, how, and with what. | Methods, Animals and surgical procedures | Graft preparation, cold perfusion with 5 mL of University of Wisconsin solution, 2 hours of storage at 4 °C, orthotopic grafting with 10-0 polypropylene sutures, isoflurane anaesthesia, tramadol analgesia, the drug product and the gavage route are all given, mostly with suppliers. | Reported |
| 9b | When and how often. | Methods, Animals and surgical procedures | A loading dose of 3 mg/kg on day 0, then 1.5 mg/kg daily by gavage. Analgesia ran for 3 days, urine was collected over 24 hours in metabolic cages, and animals were killed on days 1, 2, 5 or 7. | Reported |
| 9c | Where, including any acclimatisation period. | Methods, first paragraph | Temperature (24 °C), the light cycle (lights on 6:00, off 18:00) and the diet are given. No acclimatisation period is mentioned. | Partly reported |
| 9d | Why, meaning the rationale for the procedures. | Introduction; Results, first paragraph | The Introduction explains the model and the aim of treating early after transplantation. The Results link low doses to the trough range of current regimens. The Methods give no separate reason for the dose chosen. | Judgement call |
| 10a | Summary statistics for each group with a measure of variability. | Results; Figs 1 to 6; Table 1 | Group means with SEM are shown in the figures, and a few values appear in the text, for example 20% against 11.6% IL-1β positive tubular cells on day 7. SEM describes the precision of a mean rather than the spread of the data, the item’s own examples use SD or range, and individual animals are not plotted in Fig 1. | Judgement call |
| 10b | The effect size with a confidence interval, if applicable. | Results | No effect size or interval is reported, and results rest on P value stars. The item says “if applicable” and the authors’ checklist marks it not applicable, but the explanation and elaboration paper calls effect sizes relevant to exploratory and hypothesis-testing studies alike. | Judgement call |
Item 10 is easiest to judge with the plot in front of you. Figure 1 shows the main result for senescent cells. Bars show group means for vehicle (white) and Rapa (black) on each day, with asterisks for significance. The Methods state that results are expressed as means with SEM, the legend gives n as a range of 3 to 6, and individual animals are not drawn. With groups this small, plotting each animal would let a reader see the spread directly and check the n.
The ARRIVE 2.0 checklist scorecard
The Essential 10 breaks into 22 sub-items. In this article 9 are reported, 6 are partly reported, 5 are judgement calls and 2 are not reported. The scorecard follows the row calls in Tables 2 to 4 exactly.
| Call | Sub-items | Rows |
|---|---|---|
| Reported | 9 | 1a, 1b, 3b, 4b, 6a, 7a, 8a, 9a, 9b |
| Partly reported | 6 | 2a, 3c, 4a, 5, 8b, 9c |
| Judgement call | 5 | 2b, 3a, 9d, 10a, 10b |
| Not reported | 2 | 6b, 7b |
The pattern is useful. The article describes what was done very well, since procedures, animals and outcomes are mostly complete. The gaps sit in rows that ask the authors to justify choices, namely how the sample size was set (2b), which outcome was primary (6b), whether assumptions were checked (7b) and how large the effect was (10b). Those are rows that statistical reviewers commonly query, and each can be closed with one or two sentences written at the analysis stage. The authors’ own checklist marks row 6b as not applicable, although the Introduction states a hypothesis, which is the condition the row sets. Row 10b is softer, because the item applies only where an effect size is relevant.
Model sentences for the gaps
The square brackets below are placeholders for your own details. They are templates, not text from the article.
Sentences you can adapt
- Row 2b. The sample size was set by a power calculation for [primary outcome], using a difference of [x], a standard deviation of [y] taken from [source], a two sided alpha of 0.05 and power of 80 percent, which gave [n] animals per group.
- Row 3a. Animals would be excluded only for [stated technical or welfare reasons]. These criteria were set before data collection, and [no animal met them].
- Row 4a. Animals were allocated to groups with a computer-generated random sequence from [software], prepared by a person who did not perform the procedures.
- Row 5. The surgeon and the person giving the treatment knew the allocation. The people scoring the outcomes and running the analysis did not, and the code was broken after the analysis was locked.
- Row 7b. Normality of residuals and equality of variances were checked with [method]. Where either assumption failed we [action].
- Row 10b. For each outcome we report the difference between group means with its 95 percent confidence interval.
A short ARRIVE 2.0 checklist workflow
- Open the ARRIVE 2.0 checklist when you write the protocol, not when you write the paper. Most Essential 10 answers are design decisions.
- Draw the design on a timeline or diagram. The Experimental Design Assistant can generate one, and our ARRIVE 2.0 flow diagram generator shows total animals, exclusions, and the allocation and analysis counts for each group.
- Fix the sample size before the first animal is used. Our free sample size calculator gives a first estimate, and a primary outcome must be named to use it.
- Generate the allocation sequence with a tool and keep it. Our free randomization sequence generator generates a reproducible allocation sequence with a fixed seed, which you can store with the lab record.
- Write the exclusion rules and the blinding plan into the protocol, then report the number of animals at each stage in every legend.
- Complete the page numbers in the checklist last, and read each answer as a reviewer would, asking whether the sentence could be checked from the manuscript alone.
What the Recommended Set adds
The 11 Recommended Set items are not a second-class list. They are the context that makes the Essential 10 interpretable. In the example article, three of them are easy to verify. The Methods name the ethics authority that approved all procedures (item 14), the data availability statement says that all relevant data are within the paper and its supporting files (item 20), and the funding statement names the funder and states that the funders had no role in design, data collection, analysis, decision to publish or preparation of the manuscript (item 21). Housing details are partial, as row 9c shows. We recommend answering the Essential 10 first and then working through the Recommended Set before submission.
Frequently asked questions about the ARRIVE 2.0 checklist
How many items does the ARRIVE 2.0 checklist have?
It has 21 items. Ten form the Essential 10, which is the minimum a manuscript must report, and 11 form the Recommended Set, which adds context.
Do journals require the ARRIVE 2.0 checklist?
Many journals endorse it, and the ARRIVE 2.0 paper counts more than a thousand endorsing journals. Enforcement differs, so check the author instructions of your target journal and submit a completed checklist where one is requested.
Does ARRIVE 2.0 apply only to live animal experiments?
No. The authors state that it also applies to observational and field studies and to work that uses animal tissues, although it is most pertinent to comparative experiments in a laboratory or other formal test setting.
What is the experimental unit?
It is the biological entity that receives an intervention independently of the others, so that any two units could be assigned to different groups. It may be a single animal, a litter or a cage, and it must be stated under item 1.
Is ARRIVE 2.0 the same as a risk-of-bias tool?
No. ARRIVE tells authors what to report, while a risk-of-bias tool lets a reviewer judge a study that has already been reported. Our SYRCLE risk of bias tool guide covers it.
Free Research Tools from Editverse
- GraphPro: build publication-ready charts, 25 types, with built-in t-test, ANOVA, correlation, and chi-square p-values. Free, no signup.
- StatPro: free statistical calculators and a test-selector tool covering group comparisons, categorical outcomes, time-to-event analysis, and diagnostic accuracy.
- Flowchart Pro: generate PRISMA 2020, PRISMA-ScR, CONSORT, STROBE, STARD, MOOSE, and ARRIVE flow diagrams directly in your browser.
Professional Support for ARRIVE 2.0 Compliant Reporting
Most of the gaps in the scorecard are caught faster by a second reader who holds the checklist and the manuscript side by side. Two Editverse services map directly onto the rows above.
Reporting guideline check
Reviewer asked for your ARRIVE checklist?
$175
You send the manuscript, your study type and your target journal. You receive a completed checklist with page numbers, gap identification and revision recommendations. Animal research under ARRIVE is one of the guidelines covered. Standard turnaround is 2 to 3 business days.
Sample size
No calculation behind your n yet?
$150
You tell us the design, primary outcome and any pilot or published estimates. You receive a power analysis matched to your design, effect size estimation, several scenarios including attrition, and methods text with the software stated. 2 to 3 business days.
For language and structure work on a finished animal study manuscript, see our manuscript editing services. Our work aligns with COPE, ICMJE and GPP 2022, and follows institutional and country-specific ethics requirements.
Using the ARRIVE 2.0 checklist well
The ARRIVE 2.0 checklist rewards specifics. The example study describes its surgery, animals and outcomes in enough detail to repeat, and still leaves its clearest gains in four rows that ask for justification, which are the sample size basis, the primary outcome, the assumption checks and the effect size with an interval. Two of those rows are not reported and two are judgement calls. Treat the Essential 10 as design decisions to record as you go. Name the experimental unit, state the allocation method, say who was blind at each stage, give the exact n in every legend, and report an effect size with its interval. A reviewer reading those lines has little left to ask.
References
- Percie du Sert N, Hurst V, Ahluwalia A, Alam S, Avey MT, Baker M, et al. The ARRIVE guidelines 2.0. Updated guidelines for reporting animal research. PLoS Biol. 2020;18(7):e3000410. doi:10.1371/journal.pbio.3000410. PMID 32663219. PMCID PMC7360023.
- Percie du Sert N, Ahluwalia A, Alam S, Avey MT, Baker M, Browne WJ, et al. Reporting animal research. Explanation and elaboration for the ARRIVE guidelines 2.0. PLoS Biol. 2020;18(7):e3000411. doi:10.1371/journal.pbio.3000411. PMID 32663221. PMCID PMC7360025.
- Hoff U, Markmann D, Thurn-Valassina D, Nieminen-Kelhä M, Erlangga Z, Schmitz J, et al. The mTOR inhibitor Rapamycin protects from premature cellular senescence early after experimental kidney transplantation. PLoS One. 2022;17(4):e0266319. doi:10.1371/journal.pone.0266319. PMID 35446876. PMCID PMC9022825.
- Hair K, Macleod MR, Sena ES, et al. A randomised controlled trial of an intervention to improve compliance with the ARRIVE guidelines (IICARus). Res Integr Peer Rev. 2019;4:12. doi:10.1186/s41073-019-0069-3. PMID 31205756.
- Macleod MR, Lawson McLean A, Kyriakopoulou A, Serghiou S, de Wilde A, Sherratt N, et al. Risk of bias in reports of in vivo research. A focus for improvement. PLoS Biol. 2015;13(10):e1002273. doi:10.1371/journal.pbio.1002273. PMID 26460723.
- Avey MT, Moher D, Sullivan KJ, Fergusson D, Griffin G, Grimshaw JM, et al. The devil is in the details. Incomplete reporting in preclinical animal research. PLoS One. 2016;11(11):e0166733. doi:10.1371/journal.pone.0166733. PMID 27855228.
- Percie du Sert N, Bamsey I, Bate ST, Berdoy M, Clark RA, Cuthill I, et al. The Experimental Design Assistant. PLoS Biol. 2017;15(9):e2003779. doi:10.1371/journal.pbio.2003779. PMID 28957312.