
How to Choose the Right Statistical Test
Selecting the correct statistical test is not a matter of taste — it is determined by three things: the type of outcome you measured, the number of groups or measurements you are comparing, and whether your observations are independent or paired. Get those three right and the test almost always follows. The interactive selector above walks you through exactly those decisions; this section explains the logic behind it so you can justify your choice to a reviewer.
Step 1 — Identify your outcome (dependent variable) type
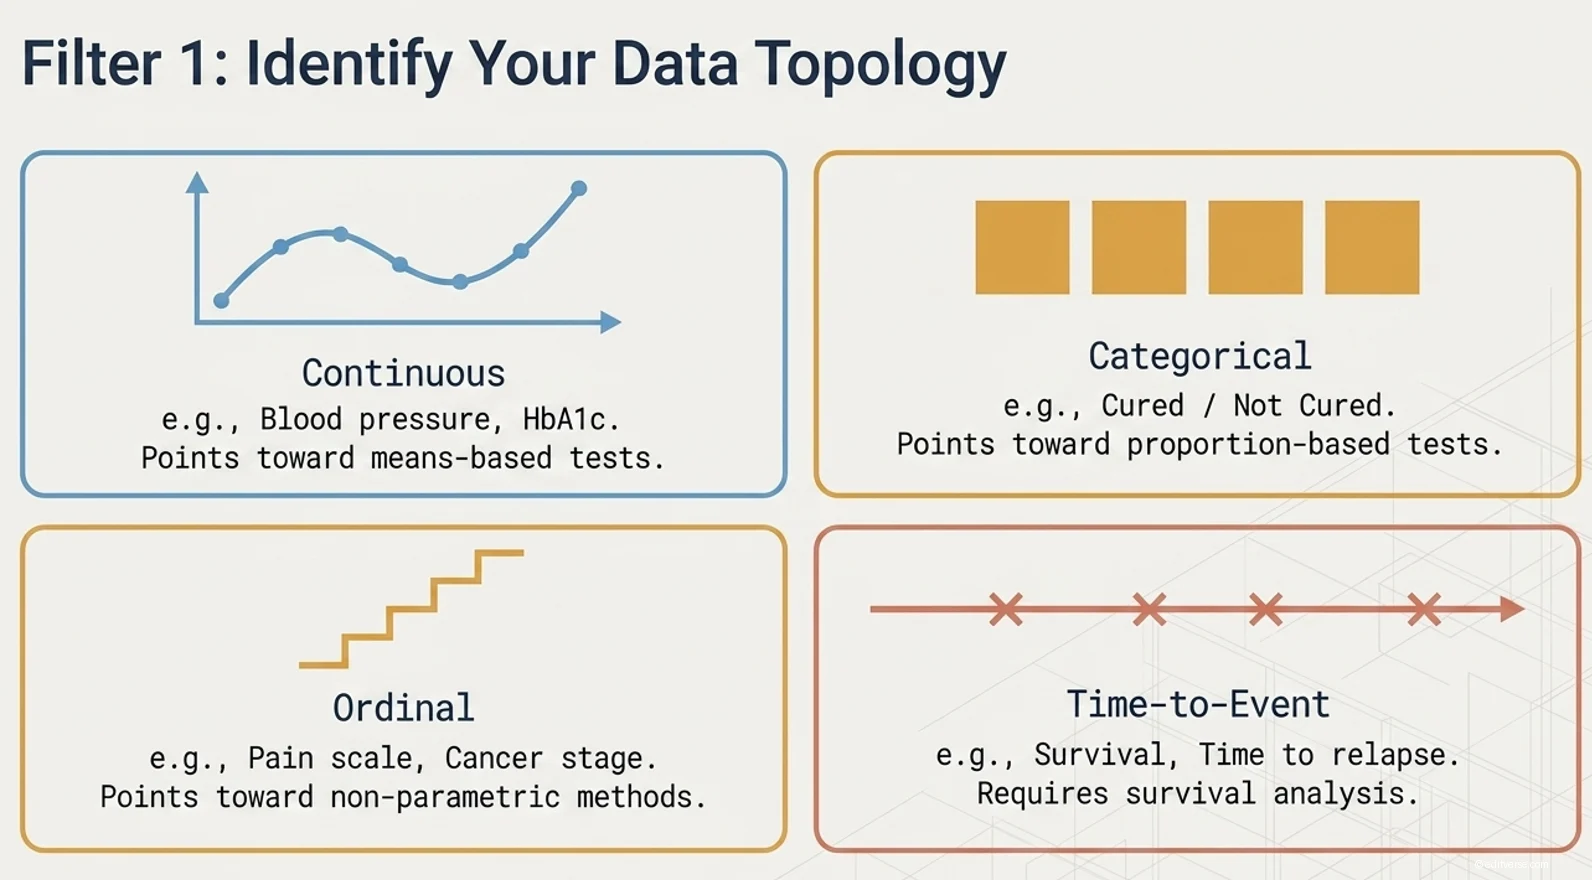
Everything starts here. A continuous outcome (blood pressure, HbA1c, a score) points toward means-based tests such as the t-test or ANOVA. A categorical outcome (cured/not cured, responder/non-responder) points toward proportion-based tests such as chi-square, Fisher's exact, or logistic regression. An ordinal outcome (a pain scale, a stage) usually calls for non-parametric methods. A time-to-event outcome (survival, time to relapse) requires survival analysis, because it must account for censored observations that a simple comparison of means cannot.
Step 2 — Count your groups and check for pairing
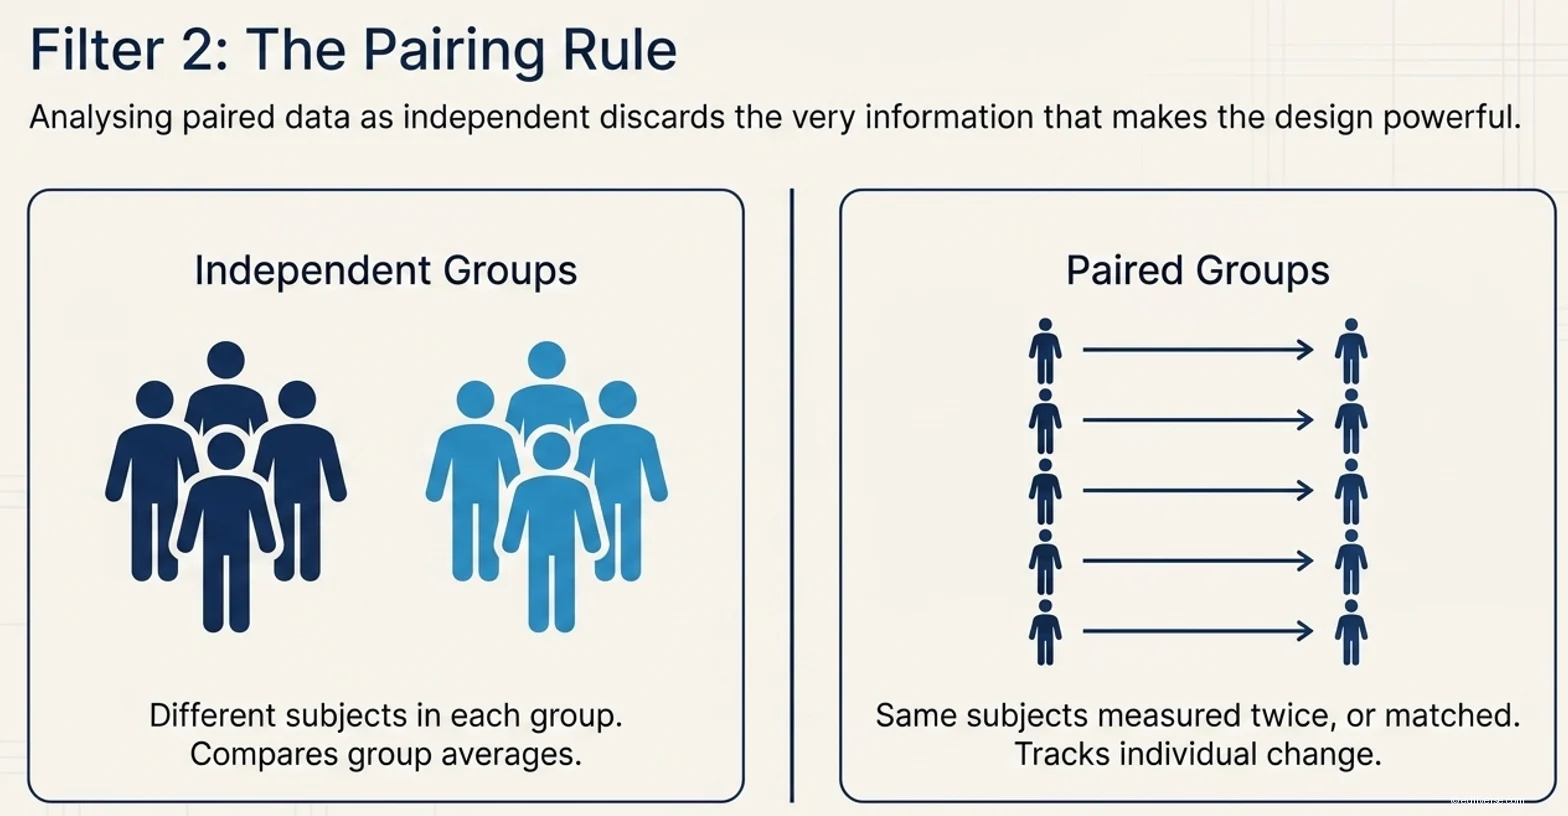
Are you comparing one group to a known value, two groups, or three or more? And are the observations independent (different subjects in each group) or paired (the same subjects measured twice, or matched)? Pairing is the most commonly missed distinction. Measuring the same patients before and after a treatment is paired data; analysing it as if the two sets of measurements came from independent groups discards the very information that makes the design powerful, and is a recognised error in the literature.
Step 3 — Check the assumptions (parametric vs non-parametric)
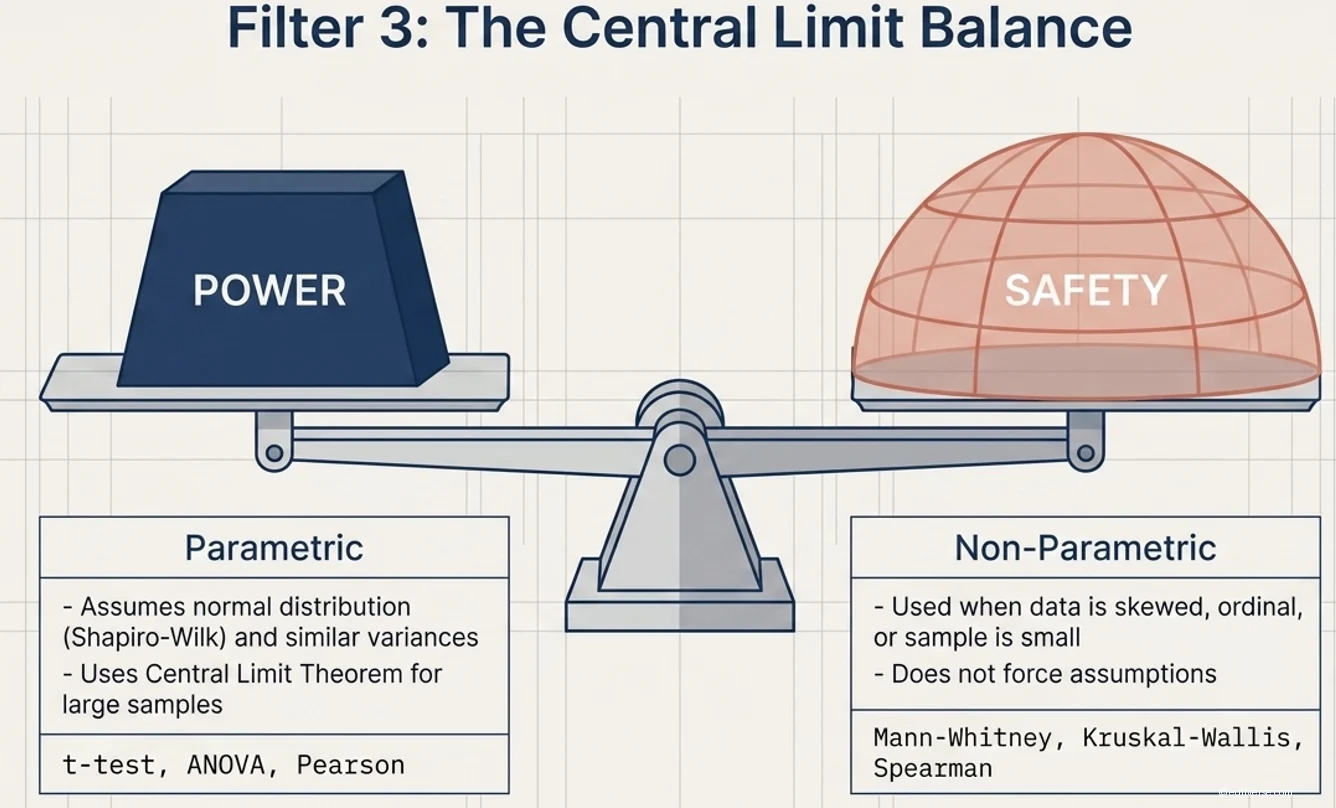
Parametric tests (t-test, ANOVA, Pearson correlation) assume the outcome is approximately normally distributed and, for group comparisons, that variances are similar. When those assumptions hold — or the sample is large enough for the central limit theorem to apply — parametric tests are more powerful. When the data are skewed, ordinal, or the sample is small, switch to the non-parametric equivalent: Mann-Whitney instead of the independent t-test, Wilcoxon instead of the paired t-test, Kruskal-Wallis instead of ANOVA, and Spearman instead of Pearson.
Step 4 — Match to the test, then verify with a calculator
Once outcome type, group structure, and assumptions are settled, the test is determined. Use the comparison table below as a quick reference, open the matching free calculator, and confirm your result against the displayed R code. For study planning, always run a sample size and power analysis before collecting data.
Visual Guide: The 3-Filter System in Action
Each slide maps directly to a step in the interactive selector above — from framework to test.




Statistical Test Selection Table
Match your study design to the right test, then open the free calculator.
| Goal / design | Outcome type | Groups | Recommended test | Calculator |
|---|---|---|---|---|
| Comparing groups | ||||
| Two independent groups, normal data | Continuous | 2 (independent) | Independent t-Test | t-Test → |
| Two independent groups, skewed/ordinal | Continuous / ordinal | 2 (independent) | Mann-Whitney U | Mann-Whitney → |
| Before/after, same subjects, normal | Continuous | 2 (paired) | Paired t-Test | t-Test → |
| Before/after, same subjects, skewed | Continuous / ordinal | 2 (paired) | Wilcoxon Signed-Rank | Wilcoxon → |
| Three or more groups, normal | Continuous | 3+ (independent) | One-Way ANOVA + Tukey | ANOVA → |
| Three or more groups, non-normal | Continuous / ordinal | 3+ (independent) | Kruskal-Wallis | In app → |
| Categorical outcomes | ||||
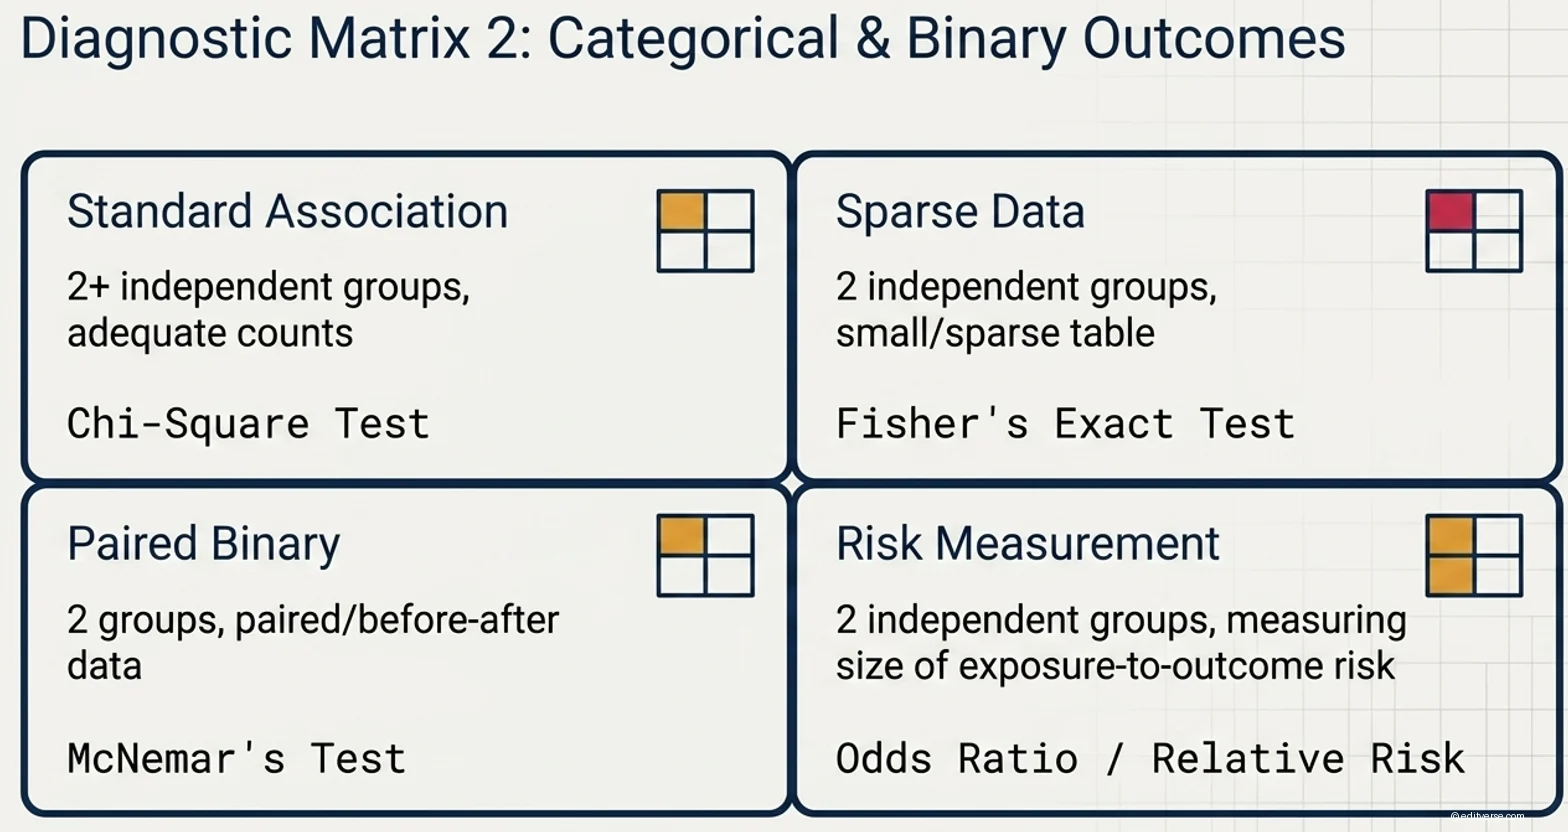
| Association, adequate counts | Categorical | 2+ (independent) | Chi-Square | Chi-Square → |
| Association, small/sparse table | Categorical | 2 (independent) | Fisher's Exact | Fisher’s → |
| Paired binary (before/after) | Binary | 2 (paired) | McNemar's Test | McNemar → |
| Size of risk (exposure → outcome) | Binary | 2 (independent) | Odds Ratio / Relative Risk | OR / RR → |
| Relationships & prediction | ||||
| Association between two variables | Continuous | — | Pearson / Spearman Correlation | Correlation → |
| Predict continuous outcome | Continuous | — | Linear Regression | Regression → |
| Predict binary outcome | Binary | — | Logistic Regression | Logistic → |
| Agreement, diagnosis & survival | ||||
| Rater agreement, categories | Categorical | 2 raters | Cohen's Kappa | Kappa → |
| Reliability / method comparison | Continuous | 2 raters/methods | ICC / Bland-Altman | ICC → |
| Diagnostic test vs reference | Binary | — | Sensitivity & Specificity | Sens/Spec → |
| Test performance across thresholds | Continuous → binary | — | ROC Curve & AUC | ROC → |
| Time-to-event with censoring | Time-to-event | 1–2 groups | Kaplan-Meier / Log-Rank | Survival → |
| Study planning | ||||
| How many participants do I need? | Any | — | Sample Size & Power Analysis | Sample Size → |
Common Mistakes in Test Selection
Ignoring that the data are paired
Analysing repeated or matched measurements as if they came from independent groups is one of the most common and consequential errors. Paired designs require paired tests (paired t-test, Wilcoxon signed-rank, or McNemar for binary data); ignoring the dependency throws away the design's efficiency and can produce misleading results.
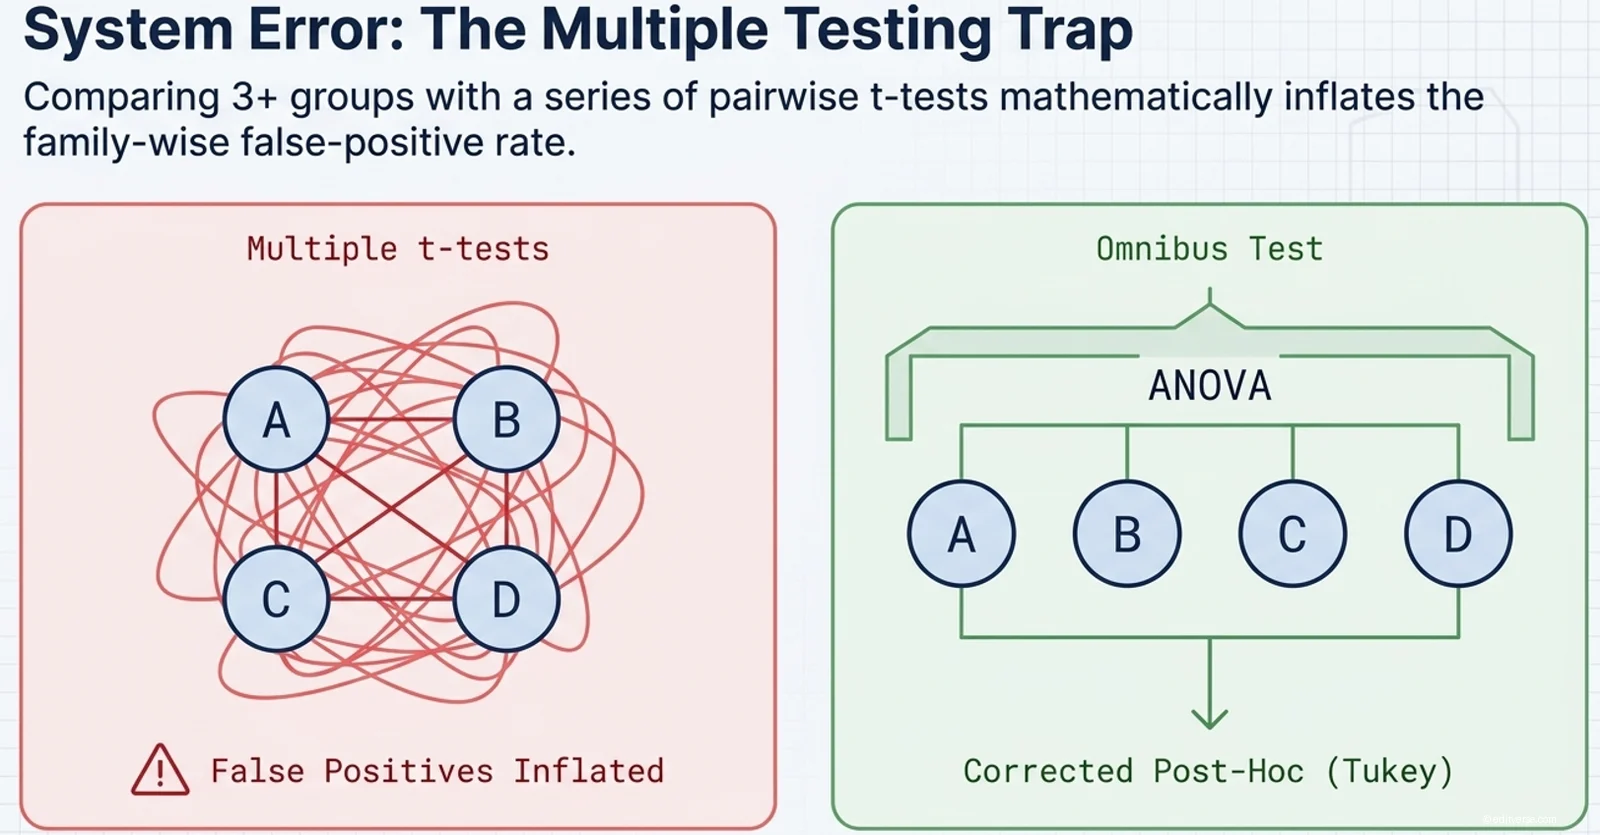
Running multiple t-tests instead of ANOVA
Comparing three or more groups with a series of pairwise t-tests inflates the family-wise false-positive rate. Use a single omnibus test (ANOVA or Kruskal-Wallis) followed by a corrected post-hoc comparison.
Using a parametric test on skewed or ordinal data
The t-test and ANOVA assume approximate normality. On clearly skewed, ordinal, or very small samples, switch to the non-parametric equivalent rather than forcing a parametric test.
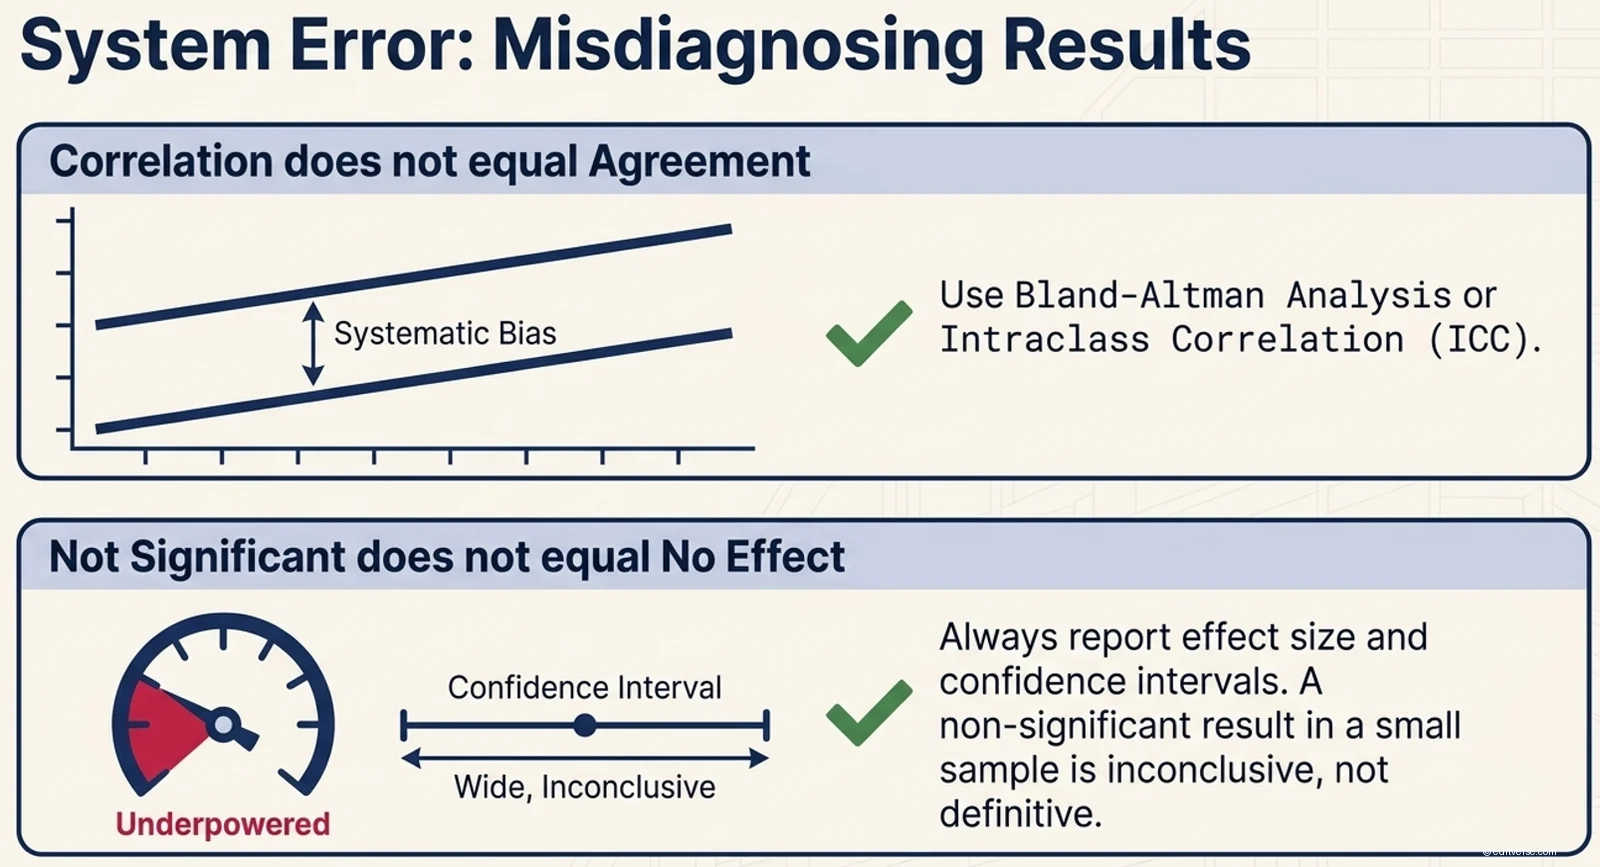
Confusing correlation with agreement
A high Pearson correlation between two measurement methods does not mean they agree — two methods can be perfectly correlated yet systematically biased. Use the intraclass correlation or a Bland-Altman analysis to assess agreement.
Treating "not significant" as "no effect"
A non-significant result in an underpowered study is not evidence of no effect. Report the effect size and confidence interval, and plan an adequately powered sample size in advance.
Uncorrected multiple testing
Testing many outcomes or fitting many models without correcting for multiplicity inflates false positives and is a recognised source of irreproducible findings.
Frequently Asked Questions
How do I know if my data are "normal"?
Inspect a histogram or Q-Q plot, and for formal testing use a normality test (Shapiro-Wilk). With large samples, mild non-normality matters little because of the central limit theorem; with small samples, prefer non-parametric tests when in doubt.
What is the difference between paired and independent data?
Independent data come from different, unrelated subjects in each group. Paired data come from the same subjects measured twice (before/after) or from matched pairs. Pairing changes the test you use, so identify it before analysing.
Parametric or non-parametric — which is better?
Parametric tests are more powerful when their assumptions hold. Non-parametric tests are safer for skewed, ordinal, or small-sample data. Match the test to your data, not the other way around.
Do I need to calculate sample size before choosing a test?
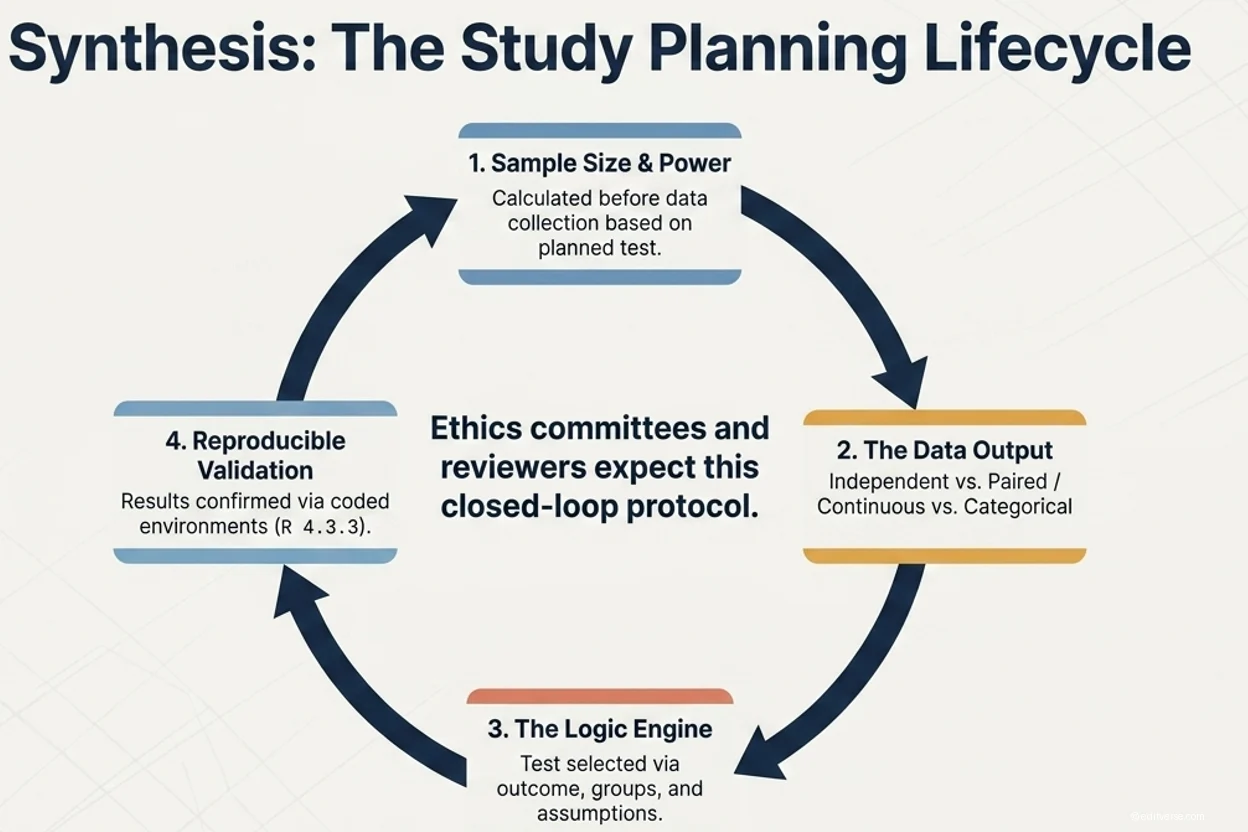
Yes. The test you plan to use determines the sample size calculation, and both should be specified in your protocol before data collection — ethics committees and reviewers expect this.
Can a statistician check my choice?
Yes. Our biostatisticians review study designs, confirm the correct test, and run the full analysis with reproducible R output as part of a statistical analysis package.
References & Further Reading
Peer-reviewed, PubMed-indexed sources on statistical test selection and reporting.
Still Not Sure Which Test Fits Your Data?
Our biostatisticians confirm the right test, check the assumptions, and run your full analysis with reproducible R output.
Get Expert Statistical Help