
Published
The SYRCLE risk of bias tool is a widely used way to judge internal validity in a systematic review of animal intervention studies. It has ten entries that cover selection, performance, detection, attrition and reporting bias plus a catch-all for other problems, and every entry is rated low, high or unclear. This guide explains each entry, compares the tool with the CAMARADES quality checklist, and then applies the ten entries to a real open-access meta-analysis of preclinical studies published in 2026. We re-derive its percentages from the per-study table, name the section behind each row, and mark the calls that two careful reviewers could score differently.
The tool was published by Hooijmans and colleagues in BMC Medical Research Methodology in 2014 as an adaptation of the Cochrane risk of bias tool for randomised trials. Four of its six authors were based at SYRCLE, the Systematic Review Centre for Laboratory animal Experimentation at Radboud University Medical Center in Nijmegen, which gives the tool its name. Our ARRIVE 2.0 guide covers what authors of animal studies should report. This guide covers the other side of the desk, which is how a reviewer judges what was reported.
In Simple Words
The SYRCLE risk of bias tool is a ten-question checklist that a reviewer fills in for every animal study in a systematic review. Each question asks whether a step that protects against bias, such as random allocation, hidden allocation or blinded outcome assessment, was clearly done. The answer is low risk, high risk or unclear risk. Most animal papers say too little, so many answers are unclear, and that pattern is itself a finding. Below, the ten questions are explained and then checked against one published meta-analysis, so you can see what a completed table looks like and where the ratings need a second look.
What the SYRCLE risk of bias tool measures
The tool keeps the logic of the Cochrane approach and changes the questions to fit animal experiments. The authors sorted the ten entries under six types of bias. Selection bias has three entries, performance bias has two, detection bias has two, and attrition bias, reporting bias and other bias have one each. By the authors’ count, five of the ten entries agree with the Cochrane tool, namely sequence generation, allocation concealment, incomplete outcome data, selective outcome reporting and other sources of bias. The remaining five reflect how animal studies differ from clinical trials, for example housing animals in shared rooms, inducing disease before or after allocation, and picking animals for outcome assessment.
Each entry comes with signalling questions that the reviewer answers yes, no or unclear. A yes points to low risk, a no points to high risk, and unclear means the report does not give enough information. If any relevant signalling question for an entry is answered no, that entry is rated high. Reviewers are also told to decide, before they start, which baseline characteristics and which other-bias items matter for their own review question, because the tool deliberately leaves those open.
One instruction is easy to miss. The tool authors write, “We do not recommend calculating a summary score for each individual study when using this tool.” Any score would need weights for the domains, and those weights are hard to defend. The tool is meant to give a profile of ten ratings per study, which a review then uses in sensitivity analysis and when it judges the certainty of the evidence. For trials in humans the current Cochrane tool is RoB 2, which we cover in our RoB 2 guide and, for applications in trial reviews, in our guide to Cochrane RoB 2.0 in trials. For prediction models the matching tool is PROBAST, explained in our PROBAST guide.
The 10 entries of the SYRCLE risk of bias tool at a glance
| Entry | Bias type | Entry name | What the reviewer asks | Marked as matching the Cochrane tool |
|---|---|---|---|---|
| 1 | Selection bias | Sequence generation | Was the allocation sequence generated with a random component and applied as planned? | Yes |
| 2 | Selection bias | Baseline characteristics | Were the groups alike at the start, or was the analysis adjusted, and was disease induced at a comparable time? | No |
| 3 | Selection bias | Allocation concealment | Could the person allocating animals have foreseen the next assignment? | Yes |
| 4 | Performance bias | Random housing | Were cages or animals placed at random within the room or facility? | No |
| 5 | Performance bias | Blinding of caregivers and investigators | Were the people caring for and treating the animals unaware of each animal’s group, and was that blinding unlikely to break? | No |
| 6 | Detection bias | Random outcome assessment | Were animals picked at random when outcomes were assessed? | No |
| 7 | Detection bias | Blinding of outcome assessors | Was the assessor unaware of group, or is the outcome unlikely to be affected by knowing it? | No |
| 8 | Attrition bias | Incomplete outcome data | Were all animals analysed, and were missing data explained, balanced across groups and handled sensibly? | Yes |
| 9 | Reporting bias | Selective outcome reporting | Were all prespecified outcomes reported, judged from a protocol or from the methods and results? | Yes |
| 10 | Other bias | Other sources of bias | Was the study free of contamination, funder influence, unit of analysis errors, design-specific risks and replaced dropouts? | Yes |
How to judge the ten entries in practice
Selection bias, entries 1 to 3
Entry 1 asks whether the allocation sequence had a genuine random component, such as a random number table or a computer generator. Allocation by investigator preference, by a laboratory result, by availability, or by animal or cage number counts as non-random. Entry 2 asks whether the groups looked alike at the start. The tool adds a second test for animal work, which is whether disease was induced at a comparable time in each group. Entry 3 asks whether the person allocating animals could have foreseen the next assignment. Third-party coding, central randomisation and sequentially numbered opaque sealed envelopes protect allocation, while open schedules and alternation do not.
Performance and detection bias, entries 4 to 7
Entry 4 is specific to animal work. It asks whether cages or animals were placed at random within the room, because shelf position, light and noise can differ across a facility. The tool accepts identical housing, such as groups sharing one cage, and treats groups kept in different rooms or on different shelves as a warning sign. Entry 5 asks whether caregivers and investigators were unaware of each animal’s treatment and whether that blinding was likely to hold. Coloured cage labels, visible drug effects and one person preparing and running the experiment all weaken it, and the tool links entry 5 back to the housing rules of entry 4.
Entry 6 asks whether animals were picked at random for outcome assessment, for instance with a random number generator. Entry 7 asks whether the assessor was blinded. For entry 7 the tool accepts an unblinded assessor when the outcome is unlikely to be influenced, mortality being its example, and it says the entry should be judged for each main outcome.
Attrition, reporting and other bias, entries 8 to 10
Entry 8 asks whether every animal entered the analysis, whether the reasons for missing data were unrelated to the outcome, whether missing data were balanced across groups and whether any imputation was appropriate. Entry 9 asks whether a protocol was available and all prespecified outcomes were reported or, without a protocol, whether the methods and results sections show that all expected outcomes appeared. Entry 10 collects the rest, including pooled or contaminating drugs, inappropriate influence of funders, unit of analysis errors such as animals caged together but analysed as independent, design-specific risks, and new animals added to replace dropouts.
SYRCLE risk of bias tool vs the CAMARADES quality checklist
CAMARADES is the Collaborative Approach to Meta-Analysis and Review of Animal Data from Experimental Studies, a research collaboration with a base at the University of Edinburgh. Its ten-item quality checklist is generally traced to stroke meta-analyses. Macleod and colleagues reported in Stroke in 2004 that studies scoring highly on a quality measure gave more precise estimates of the global effect. The example review below cites the checklist as Sena and colleagues 2007. That review, Qu and colleagues, scores peer-reviewed publication, temperature control, random allocation, blinded model induction, blinded outcome assessment, anaesthetic without intrinsic neuroprotective activity, stated animal species, sample size calculation, welfare compliance and a conflict of interest declaration, with one point for each yes.
| Feature | SYRCLE risk of bias tool | CAMARADES-style quality checklist |
|---|---|---|
| Question answered | How likely is systematic error in this study’s result, entry by entry? | Does the report show ten design and quality features? |
| Rating | Low, high or unclear risk per entry, guided by signalling questions | Yes, no or unclear per item, with a point for each yes in the Qu example |
| Summary score | Not recommended by the tool authors | A total out of 10 |
| Missing information | Rated unclear risk | Scores no point in the Qu example |
| Items only this tool has | Allocation concealment, baseline similarity, random housing, random outcome assessment, attrition, selective reporting | Peer-reviewed publication, temperature control, anaesthetic, sample size calculation, welfare compliance, conflict of interest statement |
| Field fit | Any animal intervention study | Several items (temperature control, anaesthetic without neuroprotective activity) appear to come from stroke models, so other fields adapt them |
The two instruments can disagree on the same study, and the Qu review shows how. Across its seven studies, random allocation scored yes in 7 of 7 on the checklist, yet sequence generation was rated low in only 1 of 7 on the SYRCLE table and unclear in the other 6. Blinded outcome assessment scored no in 7 of 7 on the checklist, and blinding of outcome assessors was unclear in 7 of 7 on SYRCLE. The authors explain the first gap in their own words, noting that “the method used to generate the random sequence was often not specified”. A study can say it randomised and still earn an unclear rating on entry 1 until the method is described.
The practical rule follows from that. Use the ten SYRCLE entries to judge bias and to feed the risk of bias step when you grade certainty, which our GRADE guide explains, and add CAMARADES-style items only when the review question is also about reporting quality. Keep the two in separate tables. Qu and colleagues did exactly that, and they state that their risk-of-bias judgments for GRADE were informed by the SYRCLE tool. For a wider comparison of appraisal tools across study designs, see our guide to quality assessment tools in systematic reviews.
How the example meta-analysis was chosen and checked
We searched Europe PMC for CC BY systematic reviews of animal studies that name SYRCLE and were published from June 2025 onward. The query returned 797 records, and we screened the first 300 for a main-text table that rates each study on all ten entries. We kept one whose table, written tally and licence we could all check. The article is Ali and colleagues, published in Frontiers in Pharmacology on 24 July 2026 (PMID 42568838).
Four sources agree on the licence. Crossref lists the version of record under CC BY 4.0 with a start date of 24 July 2026, Europe PMC flags the article as CC BY, the JATS full text names the Creative Commons Attribution License, and the publisher page links the CC BY 4.0 deed. The PMC copy and the publisher page both carry a correction date of 10 August 2026, and the publisher page describes the change as minor with no effect on the scientific content. We compared Table 2 and the risk of bias paragraph in the PMC copy with the publisher page on 1 November 2026 and found Table 2 identical and the same percentages in the text.
Each row below gives the section where the evidence sits, what we re-derived, and a call. Re-derived means our count from Table 2 reproduces the percentage in the text. Re-derived, rounding means the counts agree and only the first decimal differs. Judgement call means the counts agree, sometimes after rounding, but another reviewer using the signalling questions could rate the entry differently, because the article does not show the supporting text. Differs means a figure does not re-derive. Every quotation is 25 words or fewer, sits in quotation marks and was checked against the full text. This is an arithmetic and reporting check, so we did not open the 16 primary articles behind the ratings.
The empagliflozin meta-analysis behind this worked example
The review pools preclinical studies of empagliflozin in animal models of metabolic dysfunction-associated steatotic liver disease. The authors searched Scopus, Web of Science, PubMed, Wiley Online Library and the Cochrane Library, found 1,127 records, kept 816 after removing duplicates, and included 16 articles. One article, Kim and colleagues 2023, contributed two independent datasets, so the analysis has 17 rows. Thirteen articles used C57BL/6 mice and three used rats. Doses ranged from 8 to 30 mg/kg per day, and the pooled outcomes were standardised mean differences under a random-effects model.
The abstract names SYRCLE, and the full description sits in the Results, section C (“Study quality and risk of bias”), with Table 2 and Figure 2. The Methods have no separate risk of bias subsection. The article states that “Risk of bias was evaluated by two independent researchers with discrepancies resolved by the research team leader.” Each study was rated low (+), unclear (?) or high (−) on ten items labelled A to J. Letters A to J map to the ten entries in the order of Table 1 above.
SYRCLE risk of bias tool entries 1 to 3 applied to the example
| Entry | Where in the article | Evidence and re-derivation | Call |
|---|---|---|---|
| 1 | Results, section C; Table 2 column A | Low in 17 of 17 rows (100.0 percent), which matches the text’s “100% of studies”. The review’s first inclusion criterion was randomised controlled trials, which explains why every row passes. The article does not list, per study, the random component (a table or a generator) that the tool asks for, and a primary paper that only says “randomised” would normally be rated unclear. | Judgement call |
| 2 | Results, section C; Table 2 column B | Low in 15 rows, unclear in 2 (Abdalla (2023), Heo (2022)), high in none. Our arithmetic gives 88.2 percent against 88.3 percent in the text. Table 1 reports species, group size and age for most rows, which gives the reader the first baseline factors, but timing of disease induction is not rated separately. | Re-derived, rounding |
| 3 | Results, section C; Table 2 column C | Low in 1 row (Zambrano-Vásquez 2025) and unclear in 16. Our arithmetic gives 5.9 percent against 5.8 percent in the text. The Discussion supports the pattern, naming “lack of detailed reporting of allocation concealment, blinding of experiments, and randomization for outcome assessment”. | Re-derived, rounding |
Entries 4 to 7 applied to the example (performance and detection bias)
| Entry | Where in the article | Evidence and re-derivation | Call |
|---|---|---|---|
| 4 | Results, section C; Table 2 column D | Low in 15 rows and unclear in 2 (Elseweidy (2023), Perakakis (2021)). Our arithmetic gives 88.2 percent against 88.3 percent in the text. The tool accepts identical housing as a route to low risk, which may be the basis here, but the article does not say. Low on entry 4 beside unclear on entries 3, 5 and 6 for most rows is a pattern a reader may want to probe. | Judgement call |
| 5 | Results, section C; Table 2 column E | Low in 3 rows (Lee 2022, Heo 2025, Zambrano-Vásquez 2025) and unclear in 14. Our arithmetic gives 17.6 percent, the same as the text’s 17.6 percent. The tool ties this entry to the housing rules of entry 4, so a low rating on 4 with an unclear rating here is consistent. | Re-derived |
| 6 | Results, section C; Table 2 column F | Low in 2 rows (Heo 2025, Zambrano-Vásquez 2025) and unclear in 15. Our arithmetic gives 11.8 percent against 11.7 percent in the text. The article words this entry as “random for outcome assessment”. | Re-derived, rounding |
| 7 | Results, section C; Table 2 column G | Low in 11 rows and unclear in 6 (Xu (2017), Abdalla (2023), Kim (2023) (a), Kim (2023) (b), Heo (2022), Ma (2022)). Our arithmetic gives 64.7 percent, the same as the text. The tool says to judge this entry for each main outcome, and the article gives one rating per row without saying whether it was outcome-specific. The tool also accepts an unblinded assessor for outcomes unlikely to be influenced, such as mortality. The outcomes in Table 1 include histological scores such as the NAFLD activity score, so a reader may ask what the 11 low ratings rest on. | Judgement call |
Entries 8 to 10 applied to the example (attrition, reporting and other bias)
| Entry | Where in the article | Evidence and re-derivation | Call |
|---|---|---|---|
| 8 | Results, section C; Table 2 column H | Low in 17 of 17 rows (100.0 percent), matching the text. Table 1 gives one n per arm and leaves the n blank for Radlinger 2023, and the article does not show animals allocated against animals analysed. A reviewer following the four signalling questions would want that comparison before rating every row low. | Judgement call |
| 9 | Results, section C; Table 2 column I | Low in 16 rows and unclear in 1 (Abdalla 2023). Our arithmetic gives 94.1 percent against 94.2 percent in the text. The tool asks how selective reporting was examined, from a protocol or from a comparison of methods and results. The article does not state which route was used. | Judgement call |
| 10 | Results, section C; Table 2 column J | Low in 14 rows and high in 3 (Xu 2017 and both Kim 2023 datasets), which matches the text’s 82.4 and 17.6 percent. The three high ratings come from two articles. The reasons are not stated, and the tool lists contamination, funder influence, unit of analysis errors, design-specific risks and replaced dropouts as the usual candidates. | Re-derived |
The full SYRCLE table, re-derived
The matrix below copies the 17 rows of Table 2 in the article as facts and adds our column totals. Entry numbers 1 to 10 run in the order of Table 1 above. Cells use the article’s own symbols, with a plus for low risk, a question mark for unclear risk and a minus sign for high risk.
| Study row | 1 | 2 | 3 | 4 | 5 | 6 | 7 | 8 | 9 | 10 |
|---|---|---|---|---|---|---|---|---|---|---|
| Lee et al. (2022) | + | + | ? | + | + | ? | + | + | + | + |
| Petito-da-Silva et al. (2019) | + | + | ? | + | ? | ? | + | + | + | + |
| Nasiri-Ansari et al. (2021) | + | + | ? | + | ? | ? | + | + | + | + |
| Radlinger et al. (2023) | + | + | ? | + | ? | ? | + | + | + | + |
| Elseweidy et al. (2023) | + | + | ? | ? | ? | ? | + | + | + | + |
| Fu et al. (2025) | + | + | ? | + | ? | ? | + | + | + | + |
| Xu et al. (2017) | + | + | ? | + | ? | ? | ? | + | + | − |
| Perakakis et al. (2021) | + | + | ? | ? | ? | ? | + | + | + | + |
| Heo et al. (2025) | + | + | ? | + | + | + | + | + | + | + |
| Zambrano-Vásquez et al. (2025) | + | + | + | + | + | + | + | + | + | + |
| Abdalla et al. (2023) | + | ? | ? | + | ? | ? | ? | + | ? | + |
| Kim et al. (2023) (a) | + | + | ? | + | ? | ? | ? | + | + | − |
| Kim et al. (2023) (b) | + | + | ? | + | ? | ? | ? | + | + | − |
| Heo et al. (2022) | + | ? | ? | + | ? | ? | ? | + | + | + |
| Niu et al. (2023) | + | + | ? | + | ? | ? | + | + | + | + |
| Ma et al. (2022) | + | + | ? | + | ? | ? | ? | + | + | + |
| Kurtz et al. (2022) | + | + | ? | + | ? | ? | + | + | + | + |
| Low (+), n | 17 | 15 | 1 | 15 | 3 | 2 | 11 | 17 | 16 | 14 |
| Unclear (?), n | 0 | 2 | 16 | 2 | 14 | 15 | 6 | 0 | 1 | 0 |
| High (−), n | 0 | 0 | 0 | 0 | 0 | 0 | 0 | 0 | 0 | 3 |
| Low, percent of 17 | 100.0 | 88.2 | 5.9 | 88.2 | 17.6 | 11.8 | 64.7 | 100.0 | 94.1 | 82.4 |
Summed over all 170 cells, the table holds 111 low, 56 unclear and 3 high ratings. Figure 1 is the authors’ own graph of the same table, and its bars agree with the totals above.
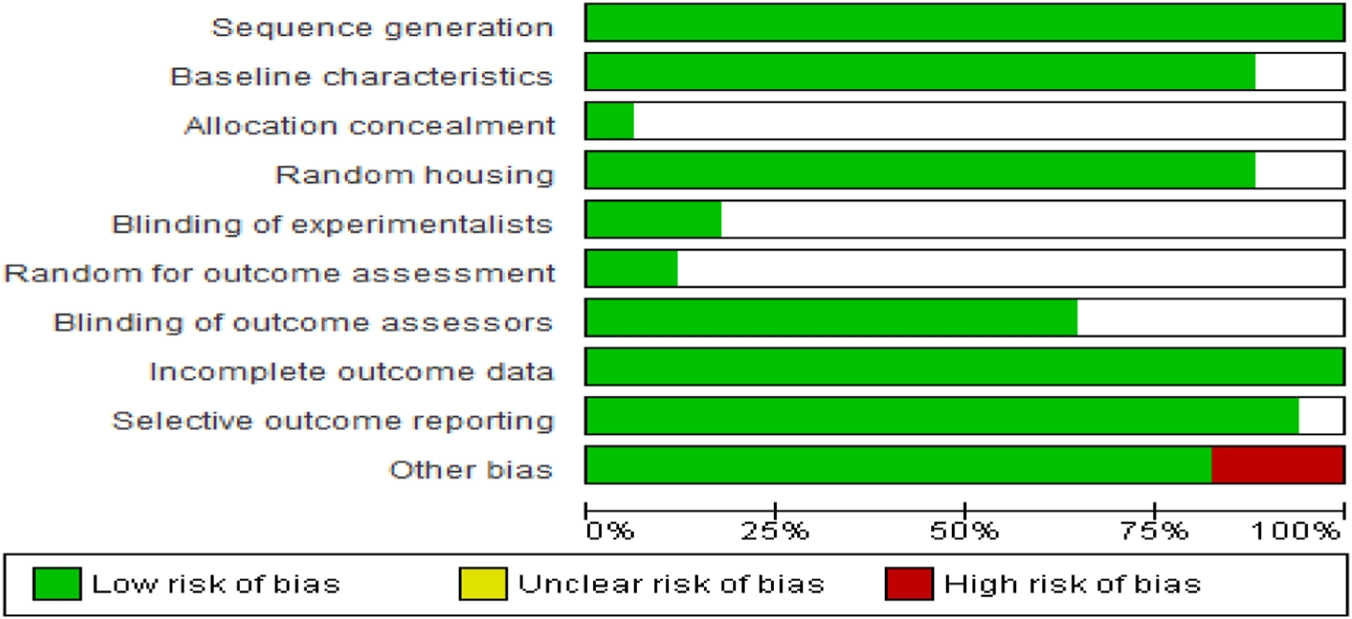
Reading a study profile across the ten entries
Reading across a row gives a study profile. Zambrano-Vásquez 2025 is the only row rated low on all ten entries. Heo 2025 is low on nine, with allocation concealment unclear. Abdalla 2023 is low on four entries (1, 4, 8 and 10) and unclear on the other six, and it is the only row with an unclear rating for selective outcome reporting. Xu 2017 and the two Kim 2023 datasets share one profile, with low ratings on entries 1, 2, 4, 8 and 9, unclear ratings on 3, 5, 6 and 7, and a high rating on entry 10.
These profiles describe a pattern and are not a ranking, since the tool authors advise against summing them. The tool paper suggests running a sensitivity analysis that drops studies at high risk. The example review ran leave-one-out analyses and a check without two studies with large standard deviations, and to our reading the article does not say whether the three high-rated rows were examined on their own.
The SYRCLE scorecard for the example
The ten entries break down as 2 re-derived, 3 re-derived with rounding differences and 5 judgement calls. The scorecard follows the calls in Tables 3 to 5 exactly.
| Call | Entries | Which |
|---|---|---|
| Re-derived | 2 | Entries 5 and 10 |
| Re-derived, rounding | 3 | Entries 2, 3 and 6 |
| Judgement call | 5 | Entries 1, 4, 7, 8 and 9 |
| Total | 10 | All ten entries |
A second check covers the figures that surround the table. Six items do not match across the article, and two of them are not trivial. We report them as differences in our arithmetic, not as errors by the authors, because the article may hold a basis that it does not show.
| Item | What the article says | What we find | Call |
|---|---|---|---|
| Overall ratings | The article states 64.1% low, 34.1% unclear and 1.8% high. | Our count from Table 2 is 111 low, 56 unclear and 3 high of 170 cells, which is 65.3%, 32.9% and 1.8%. The article’s percentages fit 109, 58 and 3 cells, so two cells differ. | Differs |
| Animals | The article gives 584 animals, with 251 in the control and intervention groups. | The n per arm in Table 1 sums to 240 over the 16 rows that state it, and the Radlinger row gives no n. The breakdown to 584 and 251 is not shown. | Differs |
| Per-entry percentages | 94.2, 88.3, 11.7 and 5.8 percent. | 94.1, 88.2, 11.8 and 5.9 percent. The differences are 0.1 percentage point and run in both directions, so they do not follow a single rounding rule. | Minor |
| Elseweidy year | Tables 1 and 2 give 2023. | The text and the reference list give 2024. | Minor |
| Ma year | The row is labelled Ma et al. (2022) in Table 1. | The year column in the same row reads 2023. | Minor |
| Figure 2 colours | The legend lists yellow for unclear risk. | The unclear segments are drawn white. | Minor |
Two rows differ and four are minor. None of them changes the picture, which is that allocation concealment, blinding of caregivers and random outcome assessment are mostly unclear in these studies. They do show why a review should publish its support statements and a cell-level table, so a reader can repeat the count.
Model sentences for reporting a SYRCLE assessment
The square brackets are placeholders for your own details. They are templates and are not text from the article.
Sentences you can adapt
- Methods. Risk of bias was assessed with SYRCLE’s risk of bias tool for animal studies, which has ten entries. Two reviewers rated each study independently as low, high or unclear risk on every entry, using the signalling questions, and resolved disagreements by discussion with [third reviewer]. We did not calculate a summary score.
- Review-specific rules. Before rating, the reviewers agreed that [baseline characteristics] and [other-bias items] were relevant to this review, and that identical housing across groups would count as low risk for entry 4.
- Outcome-level entries. Blinding of outcome assessors was judged separately for [primary outcome] and [secondary outcome].
- Support. The sentence in each report that supports every rating is given in Supplementary Table [S].
- Results. Of [n] studies, [k] described a random component for sequence generation and [k] described allocation concealment. Most studies were rated unclear on [entries], because the reports did not give the information.
A short SYRCLE workflow
- Write the review question and agree which baseline traits matter for entry 2 before any rating starts.
- Pilot the ten entries on two or three studies with both reviewers, and settle rules for entries 4, 5 and 10.
- Rate each entry independently and copy the supporting sentence from the paper into a support column, with the page number.
- Rate entry 7 for each main outcome.
- Resolve disagreements, contact authors where a detail is missing, and keep unclear when the report stays silent.
- Show a per-study table and a summary graph, and do not add the ratings into a score.
- Carry the ratings into sensitivity analysis and into the risk of bias step of GRADE for preclinical evidence, then report the review under our PRISMA 2020 guide.
Frequently asked questions about the SYRCLE risk of bias tool
How many entries does the SYRCLE risk of bias tool have?
Ten. They sit under six types of bias, which are selection, performance, detection, attrition, reporting and other bias. Each entry is rated low, high or unclear.
Is the SYRCLE tool the same as ARRIVE?
No. ARRIVE tells authors what to report, while SYRCLE lets a reviewer judge a study that has already been reported. Good ARRIVE reporting makes SYRCLE ratings easier, because fewer entries stay unclear. See our ARRIVE 2.0 worked example.
Can animals be blinded in an experiment?
Entries 5 and 7 concern people, not animals. They ask whether caregivers, investigators and outcome assessors knew which treatment each animal received.
Should reviewers calculate a SYRCLE score?
The tool authors advise against it, because a total needs weights that are hard to justify. Reviewers report the ten ratings per study and use them in sensitivity analysis.
Does the word randomised earn a low rating on entry 1?
Not by itself. The tool asks for a random component in the sequence generation, so a report that only says animals were randomised normally stays unclear until the method is given.
Which tool fits a human randomised trial?
Use RoB 2 for trials in humans. SYRCLE is built for animal intervention studies.
Free Research Tools from Editverse
- GraphPro, build publication-ready charts, 25 types, with built-in t-test, ANOVA, correlation, and chi-square p-values. Free, no signup.
- StatPro, free statistical calculators and a test-selector tool covering group comparisons, categorical outcomes, time-to-event analysis, and diagnostic accuracy.
- Flowchart Pro, generate PRISMA 2020, PRISMA-ScR, CONSORT, STROBE, STARD, MOOSE, and ARRIVE flow diagrams directly in your browser.
Professional Support for Risk of Bias Assessment and Meta-Analysis
Risk of bias tables and pooled estimates are two steps of a systematic review that need documented, checkable work. Two Editverse services map onto the steps above.
Risk of bias assessment
Need a risk of bias table for each included study?
$350
You send your included studies and their designs. You receive completed assessment forms, risk of bias tables, traffic light visualisations and a methods section narrative. Standard turnaround is 4 to 6 business days. The service page lists the tools it offers, so email co*****@*******se.com with your studies before ordering if your protocol names a specific one.
Meta-analysis
Extracted data ready to pool?
$1,000
You provide the extracted data. You receive statistical pooling with fixed or random effects, heterogeneity assessment, forest plots, a funnel plot with bias tests, sensitivity analysis, a manuscript-ready results section and the analysis files. Standard delivery is 2 to 3 weeks from data receipt.
Our work aligns with COPE, ICMJE and GPP 2022, and follows institutional and country-specific ethics requirements.
Using the SYRCLE risk of bias tool well
The SYRCLE risk of bias tool rewards specifics. The example review applies all ten entries to 17 rows, publishes a cell-level table and a written tally, and so lets a reader repeat the count. All ten per-entry percentages re-derive to within 0.1 percentage point, and the entries that stay mostly unclear, allocation concealment, blinding of caregivers and random outcome assessment, are the ones the authors name in their Discussion. The calls that deserve a second look are the high shares of low ratings on sequence generation, housing, attrition and selective reporting, where the article does not show its support. Write the support sentence for every cell, rate entry 7 for each outcome, keep CAMARADES-style items in their own table, and leave the ratings as a profile without a total.
References
- Hooijmans CR, Rovers MM, de Vries RB, Leenaars M, Ritskes-Hoitinga M, Langendam MW. SYRCLE’s risk of bias tool for animal studies. BMC Med Res Methodol. 2014;14:43. doi:10.1186/1471-2288-14-43. PMID 24667063. PMCID PMC4230647.
- Ali LS, Mostafa MO, Alsharayiah D, Elkholy MA, Ahmed KA, El-Mansy AA, et al. Hepatoprotective effects of empagliflozin in metabolic dysfunction-associated steatotic liver disease: a systematic review and meta-analysis of preclinical studies. Front Pharmacol. 2026;17:1822157. doi:10.3389/fphar.2026.1822157. PMID 42568838. PMCID PMC13448050.
- Qu G, Bi Y, Wang L, Xu L, Zhang Y, Ma Y, et al. Efficacy of Dang Gui Shao Yao San in treating vascular dementia in animal models: a systematic review and meta-analysis. Front Aging Neurosci. 2026;18:1701536. doi:10.3389/fnagi.2026.1701536. PMID 41907844. PMCID PMC13021646.
- Macleod MR, O’Collins T, Howells DW, Donnan GA. Pooling of animal experimental data reveals influence of study design and publication bias. Stroke. 2004;35(5):1203-8. doi:10.1161/01.STR.0000125719.25853.20. PMID 15060322.
- Higgins JP, Altman DG, Gøtzsche PC, Jüni P, Moher D, Oxman AD, et al. The Cochrane Collaboration’s tool for assessing risk of bias in randomised trials. BMJ. 2011;343:d5928. doi:10.1136/bmj.d5928. PMID 22008217. PMCID PMC3196245.
- Hooijmans CR, de Vries RBM, Ritskes-Hoitinga M, Rovers MM, Leeflang MM, IntHout J, et al. Facilitating healthcare decisions by assessing the certainty in the evidence from preclinical animal studies. PLoS One. 2018;13(1):e0187271. doi:10.1371/journal.pone.0187271. PMID 29324741.
- Percie du Sert N, Hurst V, Ahluwalia A, Alam S, Avey MT, Baker M, et al. The ARRIVE guidelines 2.0. Updated guidelines for reporting animal research. PLoS Biol. 2020;18(7):e3000410. doi:10.1371/journal.pbio.3000410. PMID 32663219. PMCID PMC7360023.