
Published | Last updated
Almost every researcher who reaches the synthesis stage asks the same question, usually in a panic, usually at 11pm. You have screened a few thousand records, you have five studies left, and you want to know whether that is enough. The honest answer to the minimum number of studies for meta-analysis is two, and that answer is almost useless on its own. Two studies clear the arithmetic bar. They rarely clear the bar that actually decides whether a reviewer accepts your pooled estimate, which is whether combining those studies produces a number that means anything at all.
This guide gives you the number first, then the four questions that matter more than the number, then what to do when your data fails one of them. It is written for the point in a review where the search is done, extraction is half finished, and someone has to decide whether this is a meta-analysis or a narrative synthesis.
In Simple Words
You can technically pool two studies. Whether you should depends on four things: are the studies answering the same question, can you get an effect size and its uncertainty from each one, are there enough studies to estimate how much they disagree, and are there enough to check for missing evidence. Fail the first one and you should not pool at all. Fail the third or fourth and you can still pool, you just have to change your statistical method and say so in the paper.
Quick answer: the four numbers that matter
- 2 studies is the absolute minimum for a meta-analysis. Nothing in inverse-variance weighting breaks below that.
- 3 studies is the median meta-analysis in the Cochrane Database of Systematic Reviews (interquartile range 2 to 6); 36% contain exactly two and 75% contain five or fewer.
- Below 5 studies, use the Hartung-Knapp-Sidik-Jonkman method rather than DerSimonian-Laird, and do not interpret I-squared at face value.
- Below 10 studies, do not run a test for funnel plot asymmetry. The Cochrane Handbook sets that threshold explicitly.
The count is rarely the binding constraint. Clinical coherence is: if the studies are not answering the same question, no number of them makes pooling defensible.
The Minimum Number of Studies for a Meta-Analysis Is Two
Two independent studies reporting the same outcome, each with an effect estimate and a measure of its precision, are enough to compute a weighted average. Nothing in the mathematics of inverse-variance weighting breaks at two. Cochrane reviews contain thousands of two-study meta-analyses. There is no methodological body that publishes a higher floor.
What changes as the number of studies falls is not whether you can calculate a pooled estimate. It is how much you can claim about it. With two studies you can report a summary effect. You cannot reliably describe how the effect varies across settings, and you cannot check whether studies are missing. Those are separate losses, and each one has a specific consequence at peer review that we cover below.
What the Minimum Number of Studies for a Meta-Analysis Looks Like in Practice
The most useful reality check on this question comes from the Cochrane Database itself. Davey and colleagues classified every meta-analysis containing at least two studies in the January 2008 issue of the Cochrane Database of Systematic Reviews: 2,321 reviews holding 22,453 meta-analyses drawn from 112,600 individual studies. Their finding reframes the whole question.
| Measure | Value in the Cochrane Database |
|---|---|
| Median studies per meta-analysis | 3 (interquartile range 2 to 6) |
| Meta-analyses with exactly 2 studies | 36% |
| Meta-analyses with 5 or fewer studies | 75% |
| Median sample size of a component study | 91 participants |
Three quarters of the meta-analyses in the most rigorous evidence library in medicine contain five studies or fewer. If you have four studies and you think that disqualifies you, it does not. You are in the middle of the distribution, not the tail of it. What separates a defensible small meta-analysis from an indefensible one is not the count. It is whether the author noticed which statistical guarantees they had lost and adjusted for them.
Four Gates That Matter More Than the Minimum Number of Studies for a Meta-Analysis
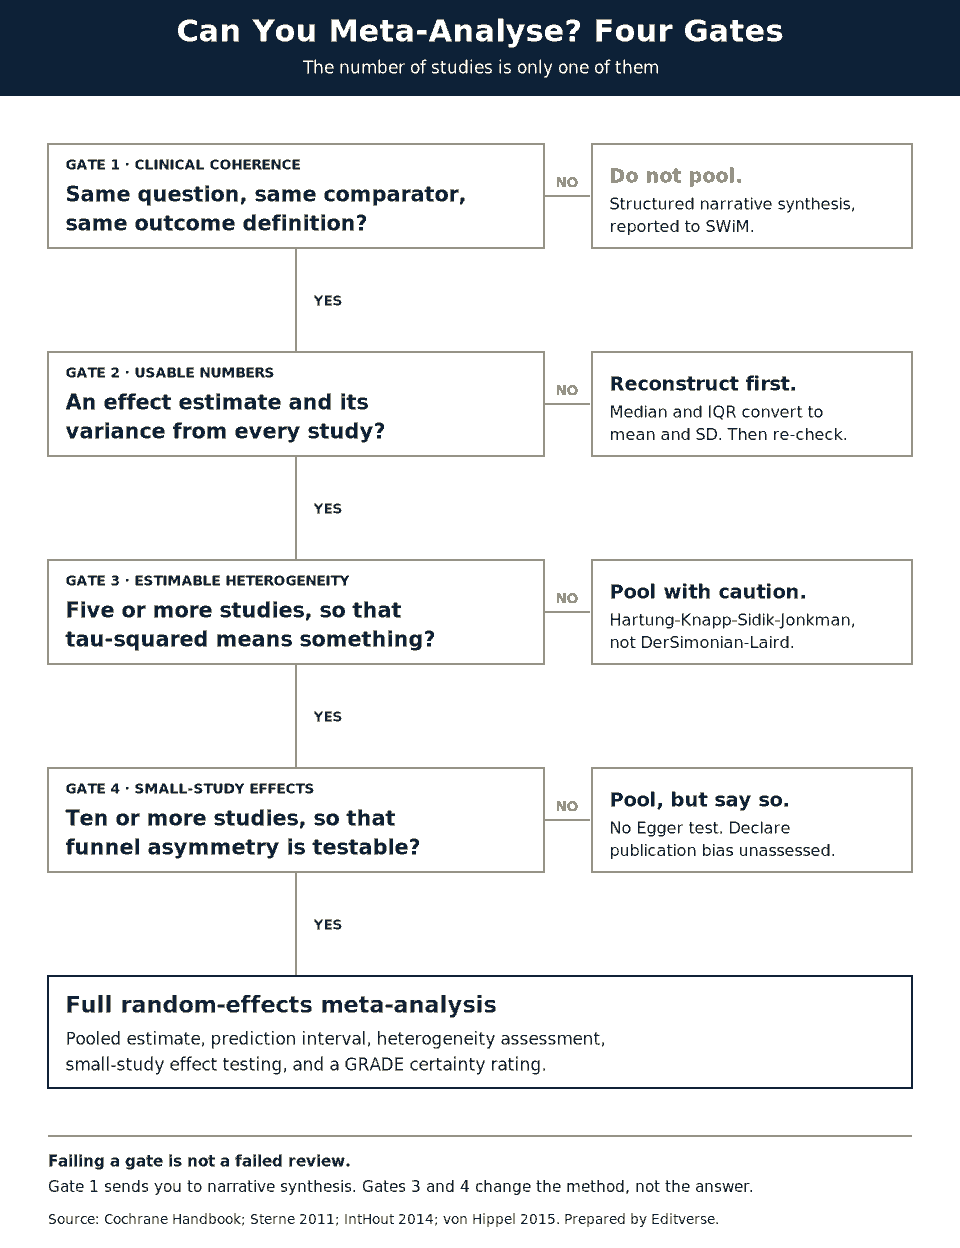
Work through these in order. The first is a hard stop. The other three change your method rather than your answer.
Gate 1. Do the studies answer the same question?
This is the gate that fails most often and gets checked least often, because it is the only one with no formula attached. Before any statistic, confirm that every study shares a population, an intervention, a comparator, and an outcome definition close enough that a single pooled number would mean something to a clinician.
Specific things that fail this gate and often slip through: an outcome measured at 6 weeks in three trials and 12 months in two; a comparator that is placebo in half the studies and usual care in the rest; a diagnostic threshold that shifted when the guideline changed mid-decade; an intervention delivered by specialists in one country and by community health workers in another. Statistical heterogeneity tests will sometimes flag these and will often miss them, because two clinically incompatible studies can produce numerically similar effect sizes by coincidence. Our guide to common mistakes in meta-analysis covers the pooling errors that follow from skipping this step.
If you fail Gate 1, stop. No amount of extra studies fixes an incoherent question, and no statistical adjustment makes an average of incomparable things interpretable.
Gate 2. Can you get an effect estimate and its variance from every study?
Inverse-variance meta-analysis needs two numbers per study: the effect and how precisely it was measured. Missing the second number is the most common practical blocker, and it is usually recoverable rather than fatal. See the recovery recipes in the next section before you exclude anything.
One warning worth stating plainly. Excluding a study because its reporting was poor, rather than because it failed your eligibility criteria, introduces a bias that is invisible in your forest plot and undocumented in your PRISMA 2020 flow diagram unless you record it as its own exclusion reason. Record it.
Gate 3. Are there enough studies to estimate how much they disagree?
A random-effects model estimates a between-study variance, tau-squared, from your data. With very few studies that estimate is unstable, and the instability propagates straight into your confidence interval.
The related statistic, I-squared, is biased in the same situation. Von Hippel calculated the bias directly and found that with 7 studies and no true heterogeneity, I-squared overestimates heterogeneity by an average of 12 percentage points, while with 7 studies and 80% true heterogeneity it underestimates by an average of 28 percentage points. The direction of the error flips depending on the truth you are trying to measure, which is why an I-squared of 40% in a five-study meta-analysis carries almost no information. Our article on managing and assessing heterogeneity works through what to report instead.
Five studies is a practical working threshold rather than a rule. Below it, the standard DerSimonian and Laird approach produces confidence intervals that are too narrow. IntHout, Ioannidis and Borm evaluated this across simulated meta-analyses of 2 to 20 trials and found that DerSimonian and Laird often produces inappropriate type I error rates, while the Hartung-Knapp-Sidik-Jonkman method performs considerably better. Röver, Knapp and Friede examined the same method specifically in the few-studies case. The practical instruction is short: below five studies, use Hartung-Knapp-Sidik-Jonkman, and report a prediction interval alongside the confidence interval so readers see the expected range of true effects rather than only the precision of the average.
Gate 4. Are there enough studies to check for missing evidence?
Here the threshold is explicit rather than a convention. The Cochrane Handbook states that tests for funnel plot asymmetry should be used only when there are at least 10 studies included in the meta-analysis, following the recommendations of Sterne and colleagues in the BMJ. Below ten, the test has so little power that a non-significant result tells you nothing, and running it anyway invites a reviewer to point out that you have misread an absence of power as an absence of bias.
With fewer than ten studies the correct move is to not run the test, say explicitly in your methods that small-study effects could not be assessed, and carry that limitation into your certainty rating. Our guide to publication bias detection and correction methods covers what the funnel plot can and cannot show at different study counts.
How to Recover Data That Looks Missing
Most studies that appear unusable at Gate 2 are usable after conversion. Before you exclude a study for incomplete reporting, work through this list.
Median and interquartile range instead of mean and standard deviation. This is the most frequent case in surgical, paediatric and health-economic literature, where skewed outcomes are reported as medians by convention. Wan and colleagues derived estimators for exactly this situation, and Luo and colleagues refined the mean estimator further (DOI 10.1177/0962280216669183).
A worked example. A trial reports n = 40, median 12, first quartile 8, third quartile 18. Using the Wan et al. quartile method, the mean is estimated as the average of the three reported values, (8 + 12 + 18) / 3 = 12.67. The standard deviation is the interquartile range divided by a sample-size-dependent factor, which for n = 40 is 1.3005, giving 10 / 1.3005 = 7.69. That study is now poolable. Note that the divisor changes with sample size, from 1.2227 at n = 15 to 1.3294 at n = 100, so it cannot be treated as a constant.
A confidence interval but no standard error. For a normally distributed effect, the standard error is the interval width divided by 3.92 for a 95% interval. For ratio measures, do this on the log scale before back-transforming.
A p-value and a point estimate but no interval. Back-calculate the standard error from the test statistic implied by the exact p-value. This fails when the paper reports only a threshold such as p < 0.05, in which case you have a range rather than a value, and the study should go into a sensitivity analysis rather than the primary pool.
Different effect metrics across studies. Odds ratios, risk ratios and standardised mean differences are convertible under stated assumptions. The conversion formulas between Cohen’s d, r, odds ratios and Hedges’ g are standard, and our free StatPro calculators cover the related effect size computations. For the underlying interpretation, see our guide to relative risk, attributable risk and odds ratios.
Change-from-baseline data with no standard deviation of the change. This requires imputing a correlation between baseline and follow-up. Impute it from a study in your own set that reports both, state the value you used, and test its influence in a sensitivity analysis.
What Changes Below Five Studies in a Meta-Analysis
The adjustments are small and specific. None of them require abandoning the meta-analysis.
| Studies | What you can report | What changes |
|---|---|---|
| 2 to 4 | Pooled estimate, prediction interval | Use Hartung-Knapp-Sidik-Jonkman. Do not interpret I-squared. No funnel plot. Expect a GRADE imprecision downgrade. |
| 5 to 9 | Pooled estimate, prediction interval, cautious heterogeneity discussion | Tau-squared becomes interpretable but stays imprecise. Still no formal test for funnel plot asymmetry. |
| 10 or more | The full toolkit | Funnel plot and asymmetry testing become appropriate. Meta-regression becomes possible, though it needs considerably more than ten studies to be informative. |
The prediction interval deserves particular attention in small meta-analyses. It reports the range of true effects expected in similar future studies, rather than the precision of the average, and IntHout and colleagues argued in BMJ Open that it should be presented routinely. A pooled confidence interval that excludes no effect, alongside a prediction interval that includes it, tells a reader something a confidence interval alone conceals. Our heterogeneity calculator computes I-squared and tau-squared, and our meta-analysis calculator will build the forest plot.
When You Should Not Pool at All
A review that declines to pool is not a failed review. It is a different, and often more honest, product. Campbell and colleagues published the SWiM reporting guideline in the BMJ precisely because reviews that use alternative synthesis methods rarely report them transparently, which casts doubt on findings that may be perfectly sound.
Structured alternatives that are publishable in their own right include synthesis grouped by intervention type with effect direction reported per study, vote counting based on direction of effect when effect sizes are not extractable, and albatross plots that display p-values against sample size when only significance is reported. Each has a place in the SWiM reporting items, and each is defensible in a way that a poorly justified pooled estimate is not.
If the evidence base will not support pooling, the review type itself may need to change. A scoping review maps what exists without requiring comparable outcomes. A narrative review synthesises across a wider literature without the constraint of a single answerable question. Our comparison of scoping, systematic and narrative review methods sets out which one your question actually needs, and the levels of evidence framework explains where each sits.
One more case belongs here. If your studies compare several different treatments rather than one intervention against one comparator, a pairwise meta-analysis with three studies per comparison may be the wrong structure entirely. A network meta-analysis uses indirect comparisons to make better use of the same evidence.
What Reviewers Ask About a Small Meta-Analysis
Small meta-analyses are rejected for predictable reasons, and every one of them is addressable in the methods section before submission.
- An I-squared value interpreted at face value with four studies. Report it if you must, then state the bias directly and rely on the prediction interval instead.
- An Egger test run on six studies. Remove it. Replace it with a sentence saying small-study effects could not be assessed at this number of studies.
- DerSimonian and Laird used with three studies and no justification. Switch the estimator or defend the choice explicitly.
- A pooled estimate presented without acknowledging imprecision. Small k drives a GRADE imprecision downgrade. Rate it yourself rather than letting a reviewer do it for you.
- Studies excluded for incomplete reporting rather than ineligibility. Recover the data using the methods above, or record the exclusion reason separately in the flow diagram.
- Subgroup analyses on a handful of studies. With five studies you do not have the power for subgroups. Pre-specify them, report them as exploratory, or drop them. Our guide to power analysis and sample size covers why underpowered comparisons mislead in both directions.
Once the pooling decision is settled, the worked examples in our meta-analysis masterclass walk through building the forest plot, reading the heterogeneity output, and interpreting the result.
Related reading: Once you have your studies, see how forest and funnel plots look in practice in Clinical Research Graphs: 10 Plots for Trials, Tests and Meta-Analysis.
Tools and Resources
Free Research Tools from Editverse
- GraphPro: build publication-ready charts, 25 types, with built-in t-test, ANOVA, correlation, and chi-square p-values. Free, no signup.
- StatPro: free statistical calculators and a test-selector tool covering group comparisons, categorical outcomes, time-to-event analysis, and diagnostic accuracy.
- Flowchart Pro: generate PRISMA 2020, PRISMA-ScR, CONSORT, STROBE, STARD, MOOSE, and ARRIVE flow diagrams directly in your browser.
For the specific calculations in this article, our publication bias calculator produces funnel plots and Egger’s test once you cross ten studies, and the heterogeneity and effect size tools linked above handle the earlier gates.
Frequently Asked Questions About the Minimum Number of Studies for a Meta-Analysis
What is the minimum number of studies for a meta-analysis?
Two. Two independent studies reporting the same outcome, each with an effect estimate and a measure of its precision, are enough to compute a pooled estimate. Cochrane reviews contain thousands of two-study meta-analyses, and no methodological body publishes a higher floor. The count is rarely what decides whether pooling is defensible.
Can you do a meta-analysis with only 2 studies?
Yes. In the Cochrane Database of Systematic Reviews, 36% of meta-analyses contain exactly two studies and the median across 22,453 meta-analyses is three. With two studies you can report a pooled estimate, but you cannot reliably estimate how much the effect varies across settings and you cannot test for missing evidence.
How many studies do you need before testing for publication bias?
Ten. The Cochrane Handbook states that tests for funnel plot asymmetry should be used only when there are at least 10 studies included in the meta-analysis. Below that the test has too little power, and a non-significant result must not be reported as evidence that no bias exists.
Is I-squared reliable in a small meta-analysis?
No. Von Hippel calculated that with 7 studies and no true heterogeneity, I-squared overestimates heterogeneity by an average of 12 percentage points, while with 7 studies and 80% true heterogeneity it underestimates by an average of 28 percentage points. Report a prediction interval instead.
Which random-effects method should you use with fewer than 5 studies?
Hartung-Knapp-Sidik-Jonkman. IntHout, Ioannidis and Borm found that the standard DerSimonian-Laird approach often produces inappropriate type I error rates, while Hartung-Knapp-Sidik-Jonkman performs considerably better. Röver, Knapp and Friede examined the same method specifically for the few-studies case.
What should you do if your studies cannot be pooled?
Use a structured synthesis without meta-analysis and report it against the SWiM guideline. Options include grouping by intervention type with the effect direction reported per study, disciplined vote counting, and albatross plots. A review that declines to pool for a stated reason is publishable in its own right.
Professional Support for Your Meta-Analysis
If you have worked through the four gates and want the analysis executed and written to journal standard, these are the services that match each outcome. Every package is delivered by statisticians working in R with reproducible scripts.
Data ready, pool it
$1,000
Standalone Meta-Analysis. You supply the extraction sheet, we handle model selection, forest plots, heterogeneity assessment, publication bias where testable, and a manuscript-ready results section. 2-3 weeks.
Whole review
$1,800
Complete SR + Meta-Analysis, Small. Protocol, search, screening, extraction, quality assessment and pooling for up to 15 studies, with I-squared, tau-squared and prediction intervals. 10-14 weeks.
Cannot pool
$1,000
Narrative Review Article. When Gate 1 fails, a thematically organised synthesis with critical analysis and gap identification, 4,000 to 6,000 words targeting a named journal. 4-6 weeks.
If you are earlier in the process and the pooling decision is still open, our PRISMA-compliant systematic review writing service covers protocol registration through to submission, and can tell you at the protocol stage which of the four gates your question is likely to fail.
The Short Answer on the Minimum Number of Studies for a Meta-Analysis
Two studies is the floor. Three is the median in the Cochrane Database. Five is where between-study variance starts to mean something. Ten is where you can test for missing evidence. None of those is a pass or fail line, and treating them that way is how good reviews get abandoned and weak ones get submitted.
The question worth asking is not how many studies you have. It is which of the four gates your evidence clears, and whether your methods section admits the ones it does not. A three-study meta-analysis that uses Hartung-Knapp-Sidik-Jonkman, reports a prediction interval, declines to interpret I-squared, states that small-study effects could not be assessed, and downgrades for imprecision is a publishable piece of work. A twelve-study meta-analysis that pools incompatible outcome definitions is not.
References
- Davey J, Turner RM, Clarke MJ, Higgins JPT. Characteristics of meta-analyses and their component studies in the Cochrane Database of Systematic Reviews: a cross-sectional, descriptive analysis. BMC Med Res Methodol. 2011;11:160. doi:10.1186/1471-2288-11-160
- von Hippel PT. The heterogeneity statistic I-squared can be biased in small meta-analyses. BMC Med Res Methodol. 2015;15:35. doi:10.1186/s12874-015-0024-z
- IntHout J, Ioannidis JPA, Borm GF. The Hartung-Knapp-Sidik-Jonkman method for random effects meta-analysis is straightforward and considerably outperforms the standard DerSimonian-Laird method. BMC Med Res Methodol. 2014;14:25. doi:10.1186/1471-2288-14-25
- Röver C, Knapp G, Friede T. Hartung-Knapp-Sidik-Jonkman approach and its modification for random-effects meta-analysis with few studies. BMC Med Res Methodol. 2015;15:99. doi:10.1186/s12874-015-0091-1
- Sterne JAC, Sutton AJ, Ioannidis JPA, et al. Recommendations for examining and interpreting funnel plot asymmetry in meta-analyses of randomised controlled trials. BMJ. 2011;343:d4002. doi:10.1136/bmj.d4002
- IntHout J, Ioannidis JPA, Rovers MM, Goeman JJ. Plea for routinely presenting prediction intervals in meta-analysis. BMJ Open. 2016;6:e010247. doi:10.1136/bmjopen-2015-010247
- Campbell M, McKenzie JE, Sowden A, et al. Synthesis without meta-analysis (SWiM) in systematic reviews: reporting guideline. BMJ. 2020;368:l6890. doi:10.1136/bmj.l6890
- Wan X, Wang W, Liu J, Tong T. Estimating the sample mean and standard deviation from the sample size, median, range and/or interquartile range. BMC Med Res Methodol. 2014;14:135. doi:10.1186/1471-2288-14-135
- Higgins JPT, Thomas J, Chandler J, et al., editors. Cochrane Handbook for Systematic Reviews of Interventions. Chapter 13: Assessing risk of bias due to missing evidence in a meta-analysis