
Published | Last updated
TL;DR: A meta-analysis pools effect estimates from multiple studies into one weighted result. The twelve-step path runs from a PICO question through a systematic search, dual-reviewer screening with a PRISMA flow diagram, standardized data extraction, risk-of-bias assessment (RoB 2 or ROBINS-I), effect-measure selection, a random-effects or fixed-effect model, forest-plot pooling, heterogeneity (I²) and publication-bias testing (Egger’s test), GRADE certainty rating, and PRISMA 2020-compliant reporting. Free calculators for each stage are linked throughout.
A meta-analysis turns a shelf of separate studies into one defensible number, and that number is only as trustworthy as the twelve steps behind it. Whether this is a first quantitative synthesis for a thesis chapter or a refinement of an existing protocol, the sequence below walks from question formulation to a publication-ready report, with the exact statistical thresholds, tools, and reporting standards that peer reviewers check first.
What Is a Meta-Analysis?
A meta-analysis is a statistical technique that combines quantitative results from multiple independent studies into a single pooled estimate of effect. Because it borrows statistical power from every included study at once, a well-conducted meta-analysis produces narrower confidence intervals than any single trial, can surface effects too small for individual studies to detect reliably, and lets researchers formally quantify how much studies disagree with each other rather than simply asserting that they do.
Meta-analysis is a statistical method, not a review type. It is almost always conducted inside a systematic review, which supplies the transparent, reproducible search and screening process that makes pooling defensible in the first place. Treating the two terms as interchangeable is one of the fastest ways to draw a reviewer objection.
In Simple Words: Imagine five small studies each testing whether a drug lowers blood pressure. Individually, none has enough patients to be fully convincing. A meta-analysis averages their results, weighting the bigger and more precise studies more heavily, so the combined answer is more reliable than any one study alone.
The Meta-Analysis Roadmap
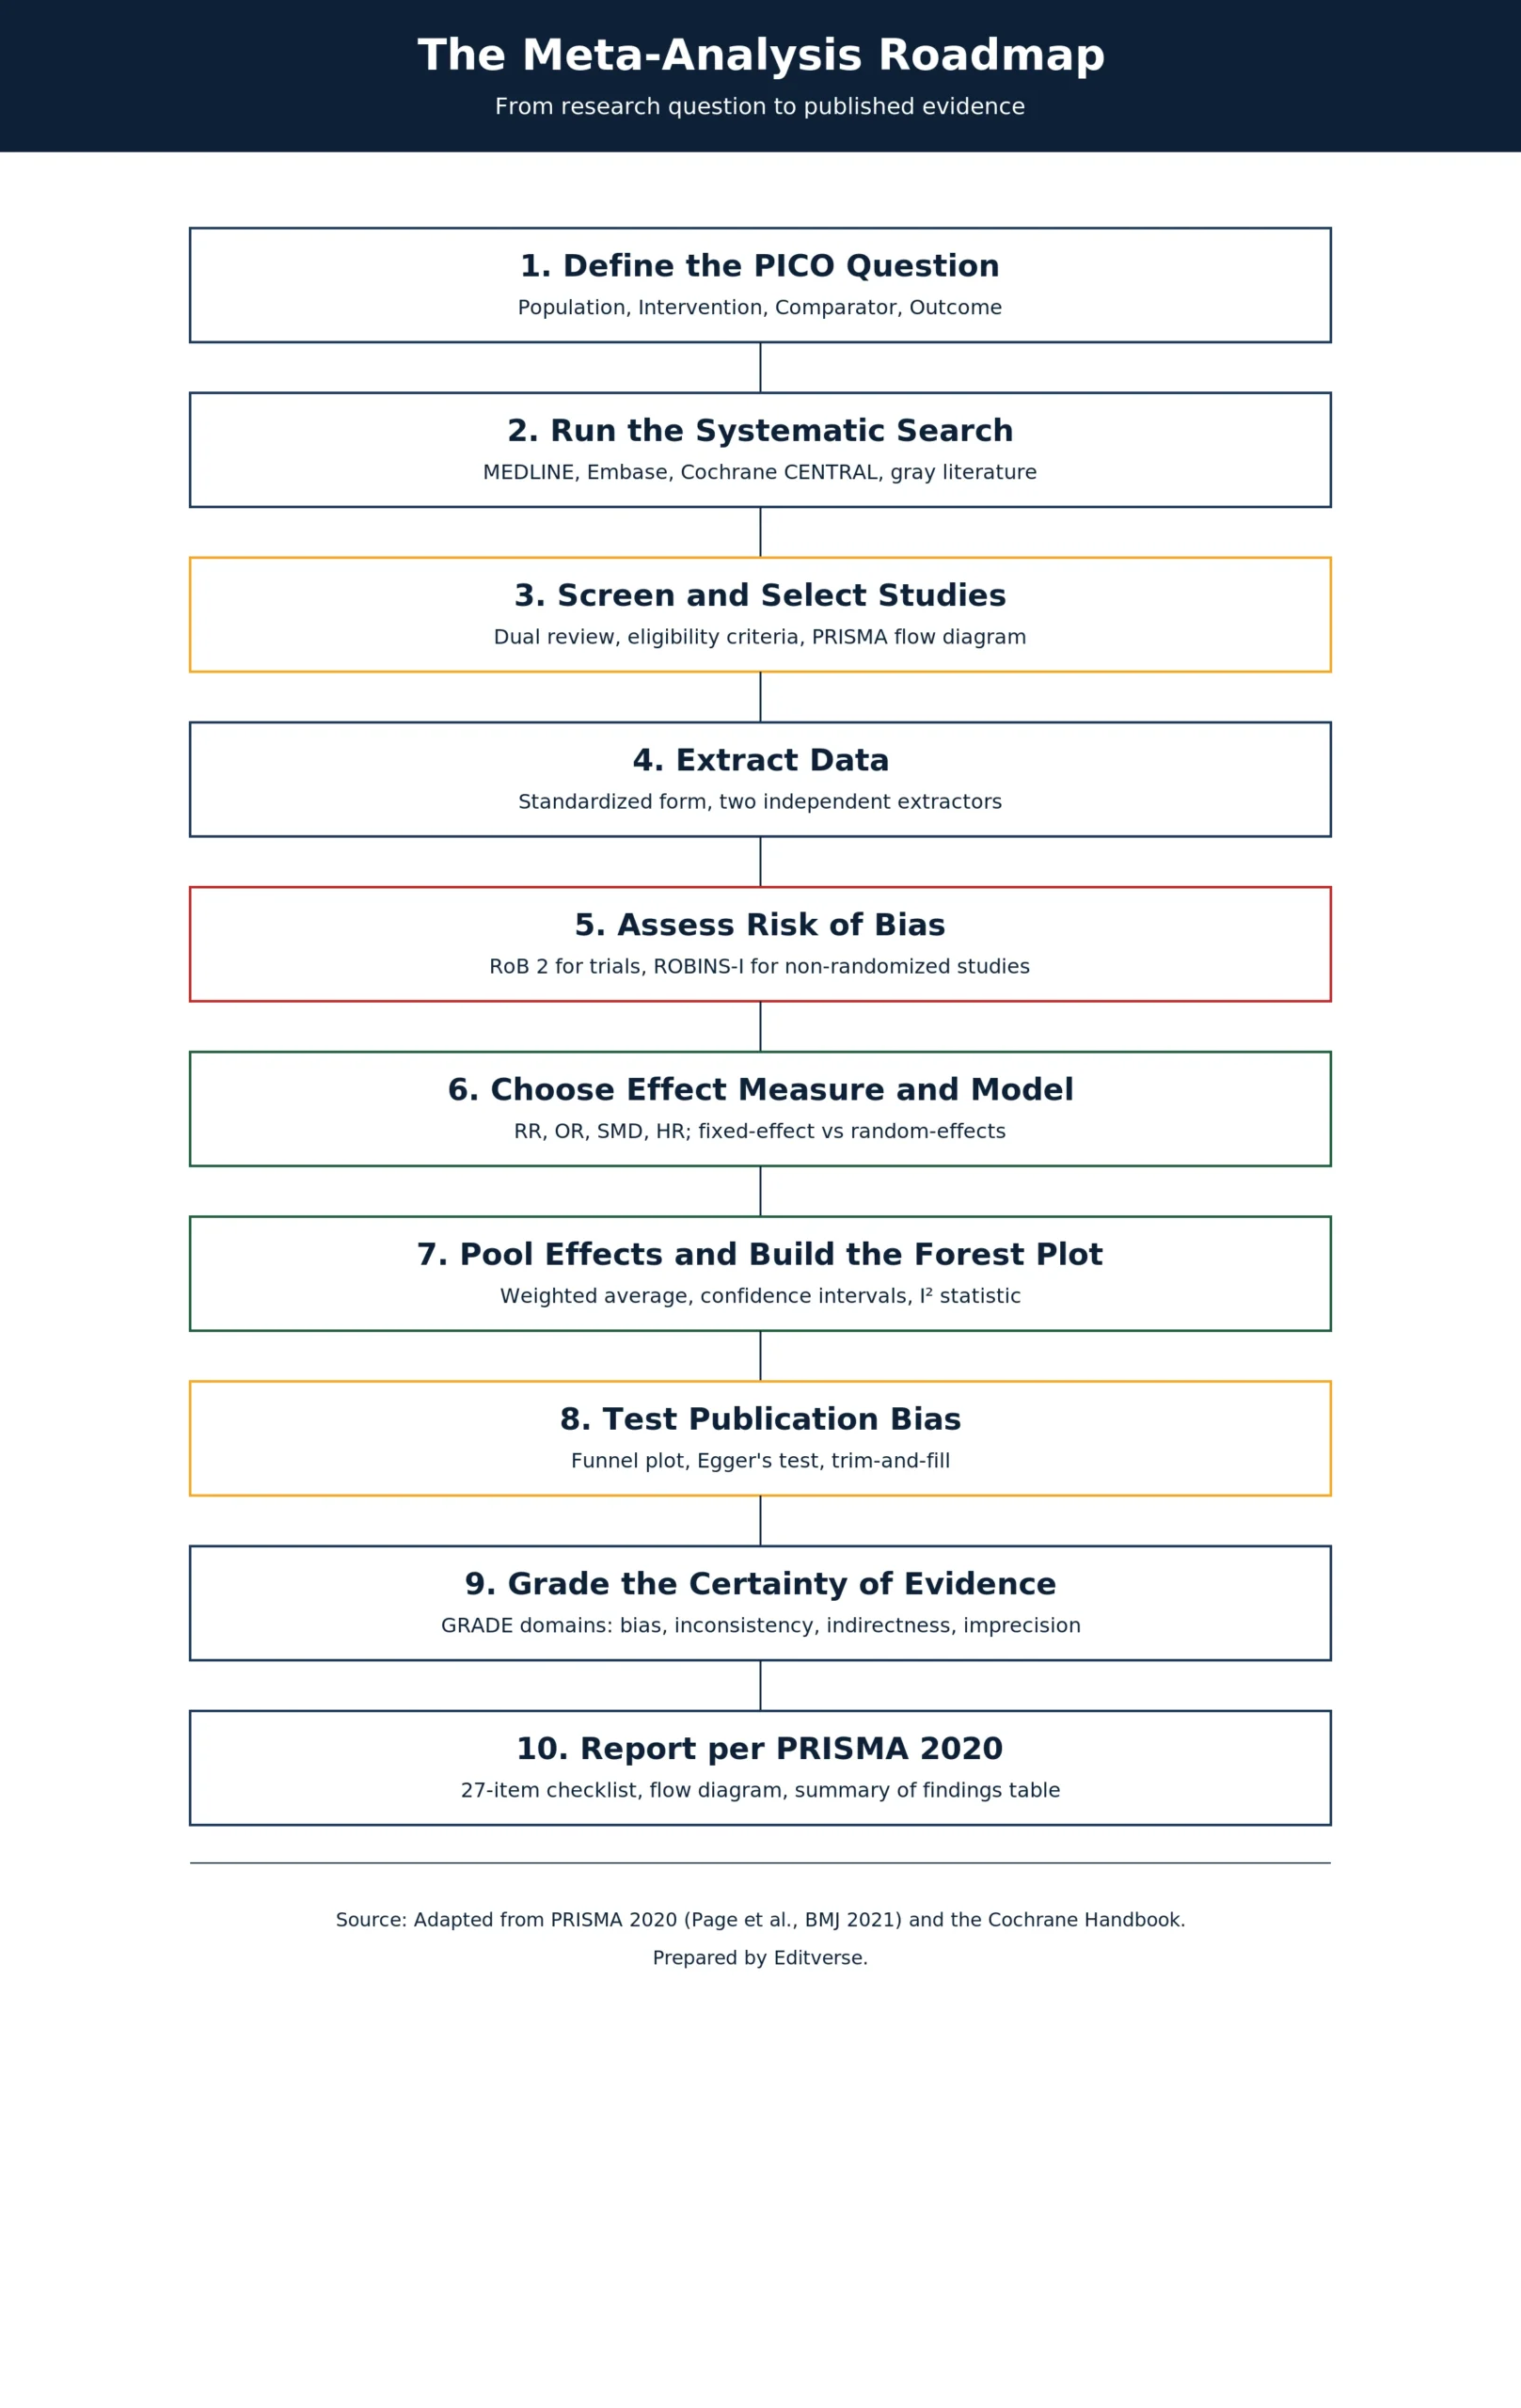
The flowchart below condenses the full process into ten checkpoints. Each is expanded step-by-step in the sections that follow.
Step 1: Define Your Research Question
Every defensible meta-analysis starts narrower than researchers expect. The PICO framework forces that narrowing. Population identifies who is being studied, Intervention or Exposure names the treatment or factor under investigation, Comparator states the control condition, and Outcome fixes exactly what is being measured. A workable example reads, “in adults with type 2 diabetes, does metformin compared with placebo reduce HbA1c levels?” A question this specific is what allows studies to be meaningfully combined later; a vague one guarantees a heterogeneous, uninterpretable pool.
Before committing to a full synthesis, it is worth running a quick power analysis on the likely number of eligible studies and their typical sample sizes. A meta-analysis of three underpowered trials will usually still be underpowered.
Step 2: Run a Systematic Search
A meta-analysis is only as complete as the search feeding it. Comprehensive identification typically spans MEDLINE/PubMed and Embase for biomedical coverage, Cochrane CENTRAL for clinical trials, and field-specific databases such as PsycINFO or CINAHL where relevant. Gray literature (dissertations, conference abstracts), trial registries like ClinicalTrials.gov, the reference lists of included studies, and direct contact with study authors complete the search and catch what database indexing alone misses.
Step 3: Screen and Select Studies
Eligibility criteria defined during protocol registration get applied here, ideally by two reviewers working independently, screening titles and abstracts first, then full texts of anything potentially eligible, with reasons for every exclusion documented rather than discarded. The output is a PRISMA 2020 flow diagram showing exactly how many records were identified, screened, excluded, and finally included, which is now a mandatory reporting element rather than an optional nicety. Meta-analyses built on observational rather than randomized evidence follow the parallel MOOSE flow diagram convention instead.
Step 4: Extract Data
A standardized extraction form captures study characteristics (author, year, country, design, sample size, follow-up), participant characteristics (age, sex distribution, disease severity, baseline values), intervention details (dose, frequency, duration, co-interventions), and the outcome data itself, whether that means events and totals for dichotomous outcomes or means, standard deviations, and sample sizes for continuous ones. Two reviewers extracting independently, with discrepancies resolved by discussion rather than by one person’s unilateral judgment, catches the transcription errors that silently distort pooled estimates.
Step 5: Assess Risk of Bias
The tool has to match the study design. For randomized controlled trials, the current standard is the Cochrane RoB 2 tool, introduced by Sterne and colleagues in BMJ in 2019, which structures the assessment across five specific domains, namely the randomization process, deviations from intended interventions, missing outcome data, measurement of the outcome, and selection of the reported result. For non-randomized studies of interventions, ROBINS-I (Sterne et al., BMJ, 2016) extends that logic across seven domains, adding confounding and participant-selection bias to the list because neither is controlled by randomization. Results are best presented as a traffic-light plot or a summary table rather than buried in text, since reviewers and readers alike scan for it first.
Step 6: Choose Your Effect Measure
The outcome type dictates the measure. Dichotomous outcomes call for a risk ratio when baseline risk varies meaningfully across studies, an odds ratio when the design is case-control or the analysis logistic, or a risk difference when an absolute, clinically interpretable number matters more than a relative one. Continuous outcomes use a mean difference when every included study measured the outcome on the same scale, or a standardized mean difference (Cohen’s d, Hedges’ g) when scales differ across studies; a free effect size converter handles the arithmetic between these formats. Time-to-event data uses the hazard ratio drawn from survival analysis. Diagnostic accuracy meta-analyses are a separate case entirely, requiring bivariate or HSROC models rather than a single pooled ratio; a dedicated diagnostic meta-analysis calculator covers that scenario. When the right test or model is genuinely unclear, a statistical test selector narrows the options quickly.
Step 7: Select the Analysis Model
A fixed-effect model assumes every included study estimates the same single true effect and is appropriate only when the studies are functionally identical in population, intervention, and setting; it returns narrower confidence intervals because it assumes away any real between-study variation. A random-effects model instead assumes true effects vary from study to study for legitimate clinical or methodological reasons, returns correspondingly wider and more conservative intervals, and is the default choice in medical research precisely because clinical heterogeneity across trial populations is the norm rather than the exception.
Step 8: Pool the Effects and Build the Forest Plot
Software choice matters less than getting the model right. RevMan remains the free Cochrane standard, Comprehensive Meta-Analysis (CMA) offers a more guided commercial interface, R’s meta and metafor packages give full flexibility for free, and Stata users typically reach for metan or metaan. Whichever tool is used, the underlying arithmetic is the same. Calculate an effect size for each study, weight each by its precision, compute the weighted average, and generate confidence intervals around it. A free meta-analysis calculator reproduces this pooling and renders the forest plot directly.
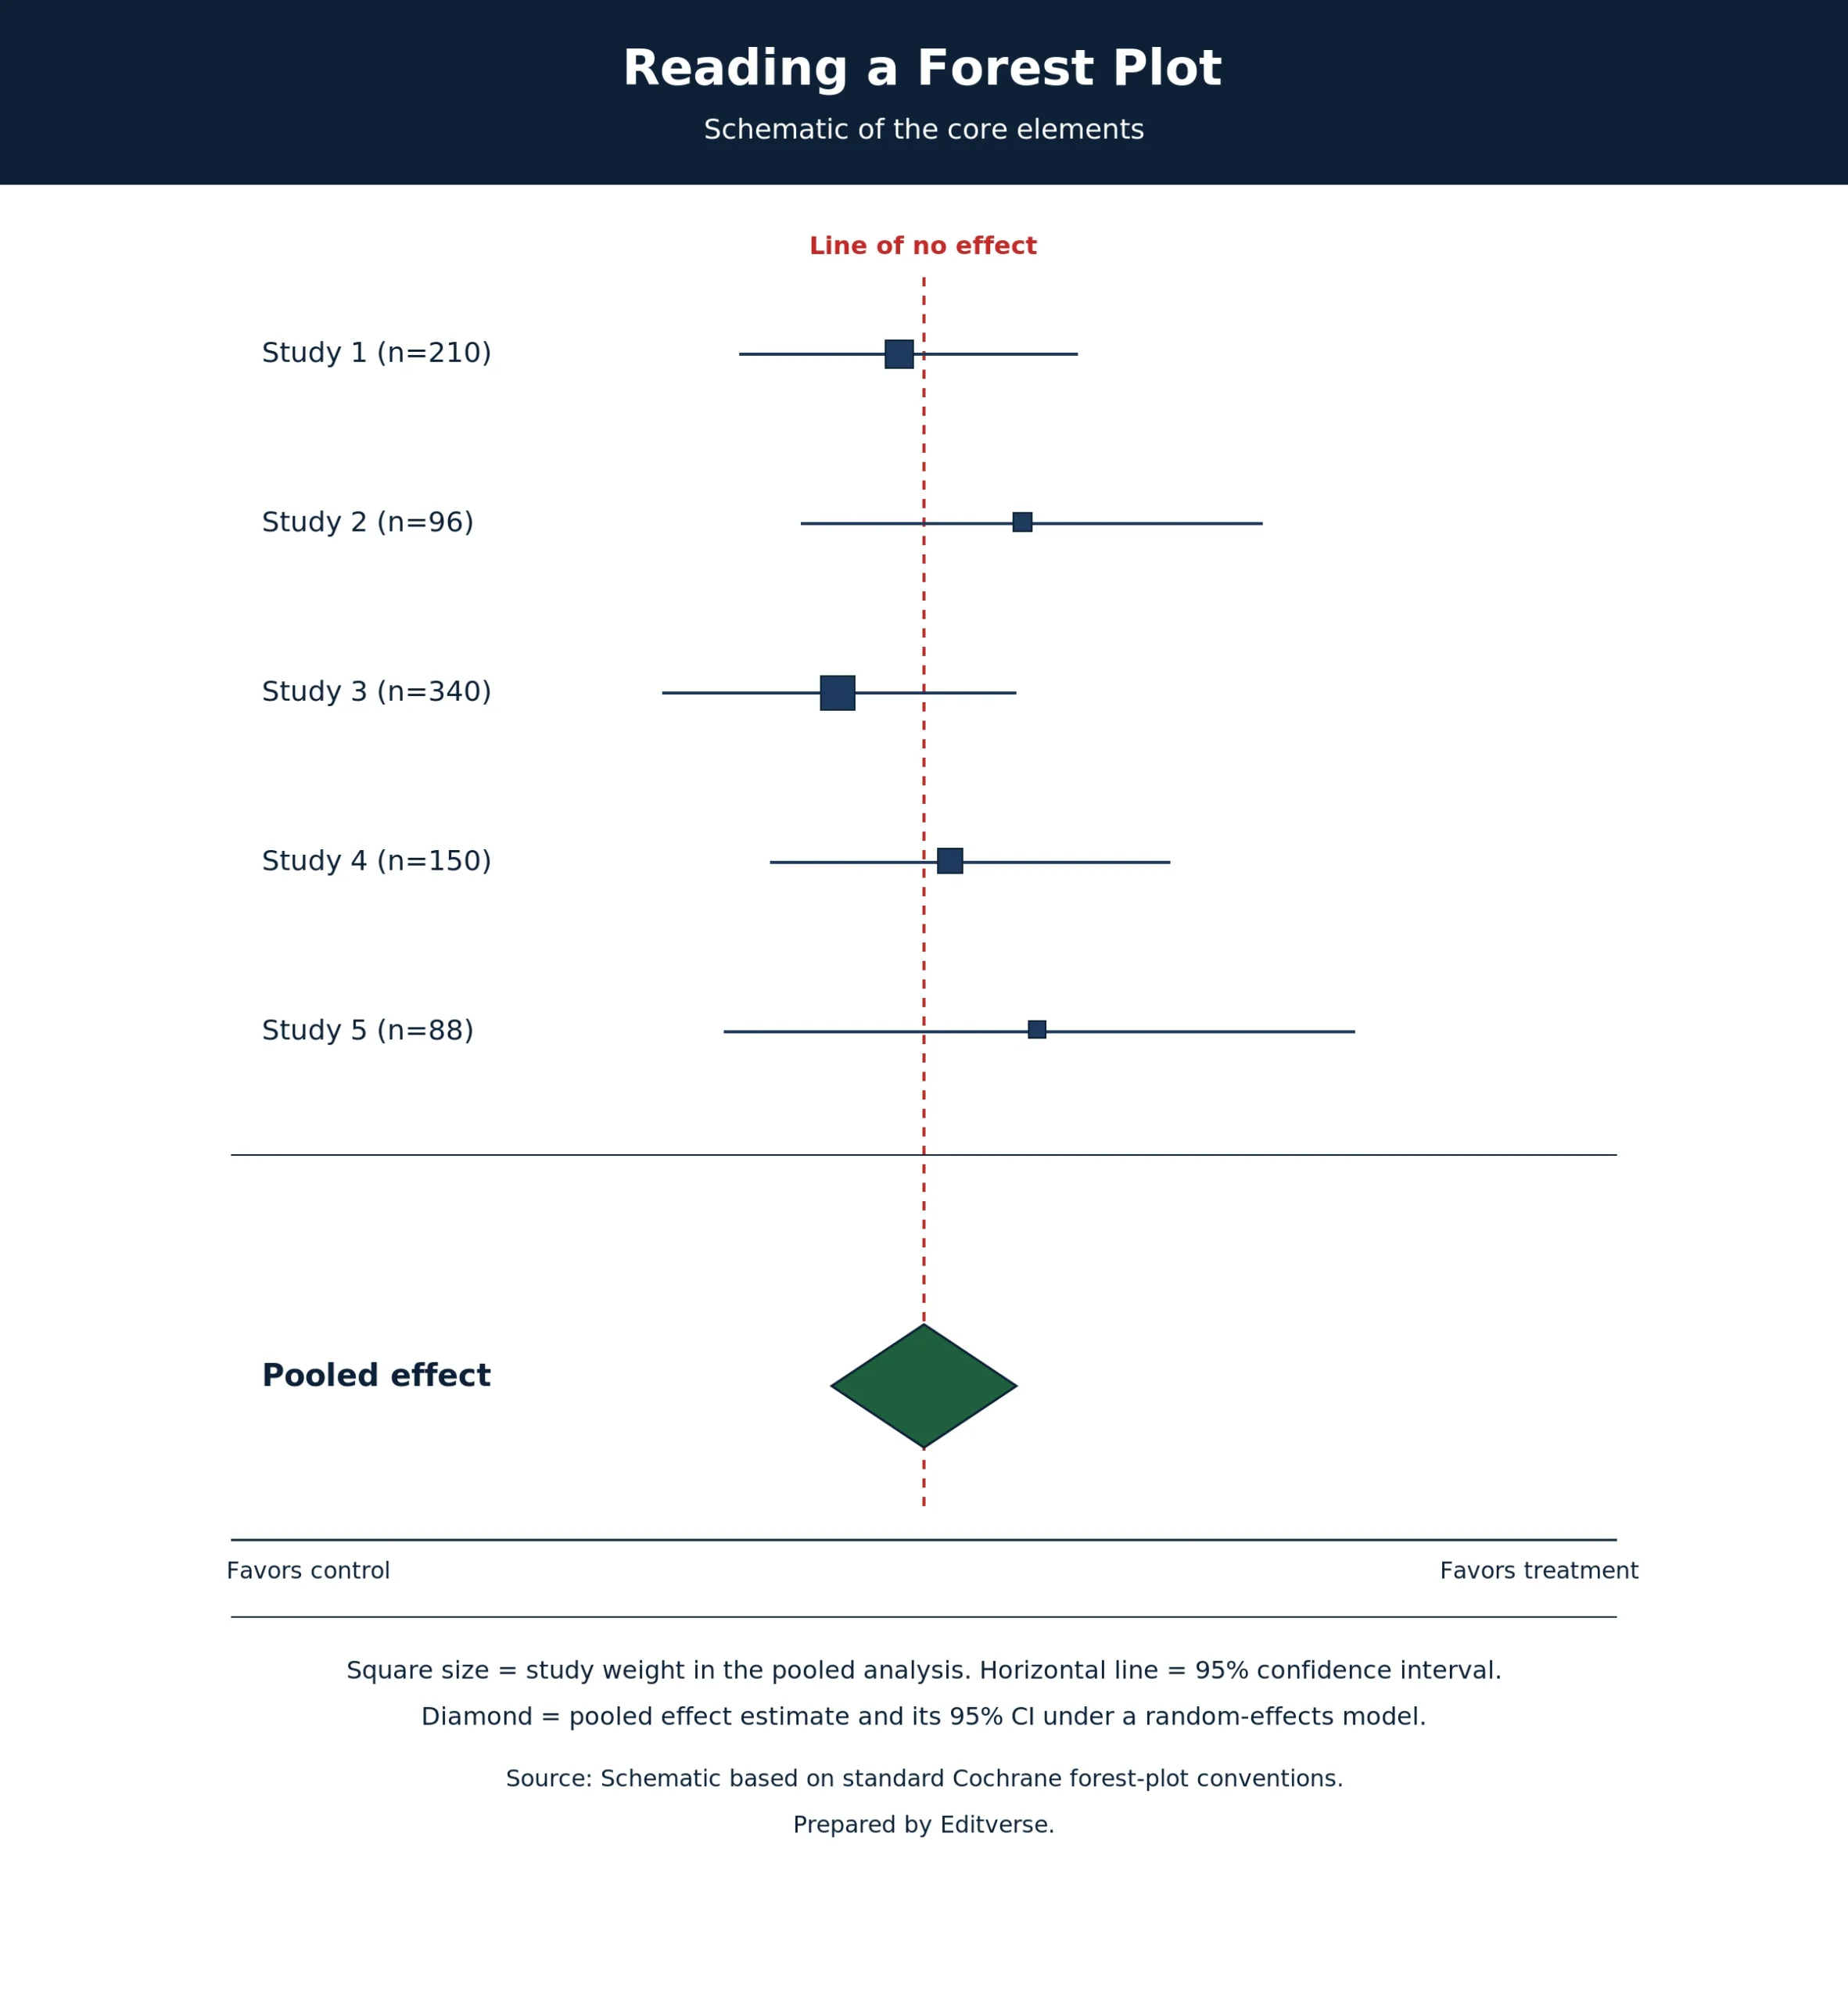
Reading the plot correctly matters as much as building it. Each study’s square sits at its point estimate, sized in proportion to its weight in the pooled analysis; the horizontal line through it spans the 95% confidence interval; and the diamond at the bottom marks the pooled effect and its own confidence interval under whichever model was chosen.
Step 9: Assess Heterogeneity
Heterogeneity is the technical name for disagreement between studies, and Higgins, Thompson, Deeks, and Altman gave the field its standard yardstick for it in a 2003 BMJ paper introducing the I² statistic, which expresses the percentage of total variation across studies attributable to genuine heterogeneity rather than chance. Conventionally, 0 to 25 percent reads as low heterogeneity, 25 to 50 percent as moderate, 50 to 75 percent as substantial, and above 75 percent as considerable. The companion Q statistic (a chi-squared test) and tau-squared (the estimated between-study variance itself) complete the standard reporting trio. A dedicated heterogeneity calculator computes all three from extracted study data. High heterogeneity is a prompt to investigate, whether through subgroup analysis stratified by clinical or methodological factors, meta-regression modeling potential effect modifiers directly, or a leave-one-out sensitivity analysis that excludes each study in turn to check whether one outlier is driving the pooled result.
Step 10: Test for Publication Bias
Publication bias arises because statistically significant, favorable results are systematically more likely to reach print than null or unfavorable ones, which skews any pooled estimate built only from what got published. Egger, Davey Smith, Schneider, and Minder formalized the standard detection method in a 1997 BMJ paper, a regression-based test for the funnel-plot asymmetry that publication bias produces; Begg’s rank correlation test offers a complementary check. Where asymmetry is detected, trim-and-fill imputes the studies that appear to be missing to estimate what the corrected pooled effect would look like. A free publication bias calculator runs the funnel plot and Egger’s test together. It is worth flagging to any co-author or reviewer that these tests have genuinely low statistical power with fewer than ten included studies, so a null result from a small meta-analysis is not strong reassurance either way.
Step 11: Grade the Certainty of Evidence
A pooled point estimate says nothing about how much confidence to place in it, which is what the GRADE approach, introduced by Guyatt and colleagues in BMJ in 2008, is built to formalize. GRADE rates overall certainty across five domains, namely risk of bias in the contributing studies, inconsistency (unexplained heterogeneity), indirectness (how well the evidence maps onto the target population and question), imprecision (confidence intervals wide enough to span clinically different conclusions), and evidence of publication bias. The resulting rating (high, moderate, low, or very low) tells a reader plainly whether further research is likely to change the estimate at all.
Step 12: Report Your Findings per PRISMA 2020
Page and colleagues published the current reporting standard, PRISMA 2020, in BMJ in 2021 as an update to the original 2009 statement, and its 27-item checklist is now the baseline that journal editors and peer reviewers check a submitted manuscript against before anything else. A compliant report includes the flow diagram from Step 3, a full characteristics-of-included-studies table, the risk-of-bias assessment from Step 5, forest plots for every primary outcome, funnel plots where publication bias was assessed, and a Summary of Findings table carrying the GRADE ratings from Step 11. Beyond the checklist itself, effect estimates need their 95% confidence intervals stated plainly, heterogeneity statistics reported rather than omitted when inconvenient, limitations discussed candidly, and the clinical interpretation kept separate from the statistical one. Manuscripts that reach this stage but still need formatting, journal-target alignment, or a full revision pass before submission are exactly what our manuscript writing services are built to support.
Common Mistakes We See in Manuscript Review
Across the manuscripts that come through Editverse for meta-analysis support, the same handful of errors recur often enough to be worth naming directly. Combining clinically or methodologically incompatible studies under a single pooled estimate is the most common, followed closely by reporting heterogeneity statistics without ever investigating what is driving them. Mismatched effect measures (using an odds ratio where a risk ratio would be more interpretable, for instance) show up often enough to suggest the choice is being made by software default rather than by outcome type. Subgroup findings routinely get presented as confirmatory rather than the hypothesis-generating signals they actually are, and a GRADE assessment is skipped more often than journal guidelines technically allow. Any one of these is a plausible ground for a major revision request; more than one together is a common route to desk rejection.
Frequently Asked Questions
How many studies do I need for a meta-analysis?
There is no fixed minimum, and two studies can technically be pooled, but heterogeneity and publication-bias tests both lose statistical power below ten studies, so results from very small pools should be interpreted cautiously and reported as such.
What is the difference between a systematic review and a meta-analysis?
A systematic review is the reproducible process of identifying, screening, and appraising all relevant studies on a question. A meta-analysis is the statistical technique, used inside that process, that pools the studies’ quantitative results into one estimate. Not every systematic review contains a meta-analysis; a meta-analysis outside a systematic search process is not defensible.
Should I use a fixed-effect or random-effects model?
Random-effects is the default for medical and health research because clinical and methodological differences between studies are the expected norm. Fixed-effect is defensible only when the included studies are close to functionally identical.
What does an I² of 60% mean?
It means 60% of the total variation across your pooled studies’ effect estimates is attributable to genuine between-study heterogeneity rather than chance, which falls in the substantial range and should prompt subgroup or sensitivity analysis before the pooled estimate is reported as the headline finding.
Which software should I use to run a meta-analysis?
RevMan is free and Cochrane’s own standard; R’s meta and metafor packages are free and highly flexible; Comprehensive Meta-Analysis (CMA) and Stata are paid options favored for their guided interfaces. All four handle fixed-effect and random-effects pooling, forest plots, and standard heterogeneity statistics.
Get Expert Support for Your Meta-Analysis
A rigorous meta-analysis draws on statistical expertise and methodological discipline at every one of the twelve steps above, and reviewers at high-impact journals check every one of them. Our team supports protocol and study design, data extraction form development, statistical analysis in R, Stata, or RevMan, forest and funnel plot generation, GRADE assessments, and manuscript writing and revision through to submission. Explore our systematic review and meta-analysis writing service or contact us for a free consultation.
References
- Page MJ, McKenzie JE, Bossuyt PM, et al. The PRISMA 2020 statement: an updated guideline for reporting systematic reviews. BMJ. 2021;372:n71. https://doi.org/10.1136/bmj.n71
- Sterne JAC, Savović J, Page MJ, et al. RoB 2: a revised tool for assessing risk of bias in randomised trials. BMJ. 2019;366:l4898. https://doi.org/10.1136/bmj.l4898
- Sterne JA, Hernán MA, Reeves BC, et al. ROBINS-I: a tool for assessing risk of bias in non-randomised studies of interventions. BMJ. 2016;355:i4919. https://doi.org/10.1136/bmj.i4919
- Higgins JPT, Thompson SG, Deeks JJ, Altman DG. Measuring inconsistency in meta-analyses. BMJ. 2003;327:557–560. https://doi.org/10.1136/bmj.327.7414.557
- Egger M, Davey Smith G, Schneider M, Minder C. Bias in meta-analysis detected by a simple, graphical test. BMJ. 1997;315:629–634. https://doi.org/10.1136/bmj.315.7109.629
- Guyatt GH, Oxman AD, Vist GE, et al. GRADE: an emerging consensus on rating quality of evidence and strength of recommendations. BMJ. 2008;336:924–926. https://doi.org/10.1136/bmj.39489.470347.AD
- Cochrane Handbook for Systematic Reviews of Interventions. https://training.cochrane.org/handbook
Reviewed by the Editverse research support team, drawing on experience supporting systematic review and meta-analysis manuscripts across biomedical and clinical disciplines. Last updated July 2026.