
Discover the top 5 statistical software packages for social science research. We explore essential tools for quantitative analysis and data visualization in Statistical Software, Social Science.

Discover the top 5 statistical software packages for social science research. We explore essential tools for quantitative analysis and data visualization in Statistical Software, Social Science.

Discover how to select the perfect graph type for your research data. Our guide helps researchers effectively communicate findings through optimal data visualization.
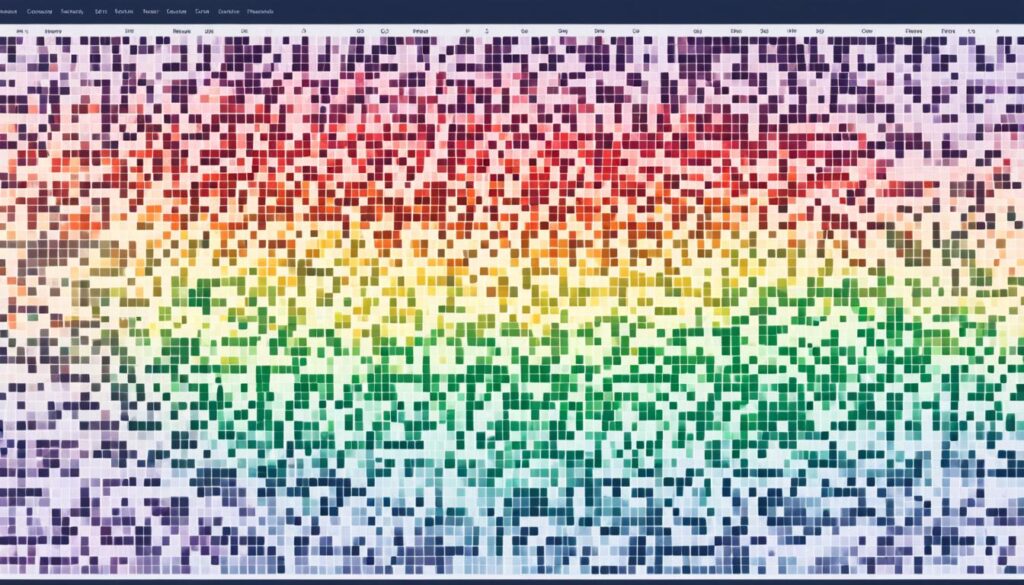
Discover how heatmaps revolutionize complex data visualization in research. Learn to leverage this powerful tool for insights across various fields and applications.

“Without data, you’re just another person with an opinion.” – W. Edwards Deming. This quote shows why Big Data Analytics is key in research for 2024-2025. With over 328.77 million terabytes of data created daily, and 120 zettabytes yearly, advanced data analytics is vital for analyzing these huge datasets1. The market for big data analytics is expected to hit $84 billion by 20241. In today’s…

“The greatest problem of communication is the illusion that it has been accomplished.” – George Bernard Shaw. This quote is very true for academic research. In this field, complex scientific data needs to be made easy to understand and share. Looking ahead to 2024-2025, the need for data visualization tools is huge. These tools change complex data into easy-to-understand visuals. This helps researchers find insights…