
Published
The Newcastle-Ottawa Scale (NOS) is a star-based rating tool built to judge the methodological quality of non-randomised studies in systematic reviews and meta-analyses, with one version for cohort studies and one for case-control studies. A study earns stars in three domains, and the maximum is nine. This guide walks through both versions item by item, scores a hypothetical cohort study star by star, shows how to report the scale in a methods section, and sets out what the published literature says about its reliability and limits.
In Simple Words
The Newcastle-Ottawa Scale gives a cohort or case-control study up to nine stars. Stars are earned for choosing the right groups (selection), for making those groups alike (comparability), and for measuring what happened (outcome in cohort studies, exposure in case-control studies). More stars means fewer design weaknesses are visible in the paper. The scale does not say how big an effect is, and its own documents set no cut-off for “good” or “poor”.
What the Newcastle-Ottawa Scale Measures and Who Built It
The Ottawa Hospital Research Institute describes the Newcastle-Ottawa Scale as a tool for assessing the quality of nonrandomised studies, such as case-control and cohort studies, for use in systematic reviews and meta-analyses. It grew out of a collaboration between the Universities of Newcastle (Australia) and Ottawa (Canada). The institute lists the source as Wells GA, Shea B, O’Connell D, Peterson J, Welch V, Losos M and Tugwell P, “The Newcastle-Ottawa Scale (NOS) for assessing the quality of nonrandomised studies in meta-analyses”, and hosts the coding manual and the rating sheets for download.
The scale uses a star system. Each study is judged from three perspectives, namely the selection of the study groups, the comparability of the groups, and the ascertainment of either the exposure or the outcome of interest. The same page states that content validity and inter-rater reliability have been established, while criterion validity, intra-rater reliability and construct validity were still under evaluation. That last sentence matters for how much weight a star total can carry, and later sections return to it.
Two points shape everything that follows. First, the NOS appraises a whole study, not a single result. Second, it was designed for observational designs where participants were not randomised. If your review includes randomised trials, you need a different tool, and our guide to quality assessment tools in systematic reviews compares the options by study design.
Newcastle-Ottawa Scale Structure: Three Domains, Nine Stars
Both versions share one architecture. According to the rating sheets, a study can be awarded a maximum of one star for each numbered item within the Selection category and within the Outcome category (cohort version) or Exposure category (case-control version). A maximum of two stars can be given for Comparability. Four selection items, one comparability item worth up to two stars, and three outcome or exposure items give nine stars in total for either version.

The difference between the versions sits in the third domain. A cohort study is judged on how the outcome was assessed and followed up, because the exposure is known at the start. A case-control study is judged on how the exposure was ascertained, because the outcome is known at the start. If you are unsure which design a paper really used, our explainer on cohort and case-control designs and their effect measures separates them.
The Cohort Version Item by Item
The table below restates the cohort rating sheet. The “star” column lists the responses the sheet marks with a star, and the “no star” column lists the rest.
| Domain | Item | Earns a star | No star |
|---|---|---|---|
| Selection | 1. Representativeness of the exposed cohort | Truly representative of the average exposed person in the community, or somewhat representative | Selected group of users (for example nurses or volunteers); no description of how the cohort was derived |
| Selection | 2. Selection of the non-exposed cohort | Drawn from the same community as the exposed cohort | Drawn from a different source; no description |
| Selection | 3. Ascertainment of exposure | Secure record (for example surgical records), or structured interview | Written self-report; no description |
| Selection | 4. Outcome of interest not present at start | Yes, demonstrated | No |
| Comparability | 1. Comparability of cohorts by design or analysis | Up to 2 stars. One for controlling the most important factor, one for any additional factor | No control for either |
| Outcome | 1. Assessment of outcome | Independent blind assessment, or record linkage | Self-report; no description |
| Outcome | 2. Follow-up long enough for outcomes to occur | Yes, using an adequate follow-up period chosen for the outcome | No |
| Outcome | 3. Adequacy of follow-up | Complete follow-up, or losses unlikely to introduce bias (small number lost above a chosen percentage, or a description of those lost) | Follow-up rate below the chosen percentage with no description of those lost; no statement |
The Case-Control Version Item by Item
The case-control sheet keeps the same selection and comparability skeleton but replaces the outcome block with three exposure items. It also asks whether cases and controls were handled the same way, which has no cohort equivalent.
| Domain | Item | Earns a star | No star |
|---|---|---|---|
| Selection | 1. Is the case definition adequate? | Yes, with independent validation | Record linkage or self-report only; no description |
| Selection | 2. Representativeness of the cases | Consecutive or obviously representative series of cases | Potential for selection bias, or not stated |
| Selection | 3. Selection of controls | Community controls | Hospital controls; no description |
| Selection | 4. Definition of controls | No history of disease (endpoint) | No description of source |
| Comparability | 1. Comparability of cases and controls by design or analysis | Up to 2 stars. One for the most important factor, one for any additional factor | No control for either |
| Exposure | 1. Ascertainment of exposure | Secure record, or structured interview blind to case/control status | Interview not blinded; written self-report or medical record only; no description |
| Exposure | 2. Same method of ascertainment for cases and controls | Yes | No |
| Exposure | 3. Non-response rate | Same rate for both groups | Non-respondents described; rate different and no designation |
Coding Manual Rules That Change Your Score
The star sheets are short, and most scoring disagreements come from the coding manual, which carries the rules the sheets leave out. Several of them deserve a place in your review protocol before anyone opens a paper.
- Comparability needs design or analysis, not a p-value. The manual states that either the groups must be matched in the design or confounders must be adjusted for in the analysis, and that statements of no differences between groups, or of differences that were not statistically significant, are not sufficient. If the relative risk (or odds ratio in case-control studies) is adjusted for the listed confounders, the groups count as comparable on each variable used in the adjustment.
- You choose the “most important factor”. The sheet leaves a blank for it, and the second comparability star can be tied to a specific second factor. Fix both in the protocol so every rater applies the same list.
- Follow-up length is set before assessment. The manual says an acceptable length of time should be decided before quality assessment begins, and gives five years for exposure to breast implants as its example. The same logic applies to the retention percentage in the adequacy-of-follow-up item.
- Outcome evidence depends on the outcome. For a hip fracture, reference to the medical record is enough to confirm the event, but vertebral fracture needs reference to x-rays.
- Mortality studies still need “no prior disease”. For death outcomes, the outcome of interest is still the presence of the disease or incident, so a statement of no history of the disease earns the star.
- Control definition depends on the case definition. If cases are a first occurrence, the paper must state that controls have no history of the outcome. If cases are new but not necessarily first occurrences, controls with previous occurrences should not be excluded.
- Case definition asks for independent validation. The manual gives examples such as more than one person, record, time or process extracting the information, or reference to a primary record source such as x-rays or hospital records.
Scoring a Cohort Study With the Newcastle-Ottawa Scale, Star by Star
The example below is hypothetical, built by Editverse to show the mechanics. Imagine a published cohort comparing hospital employees who work regular night shifts with colleagues on day shifts, followed for incident type 2 diabetes. Our review protocol, written before screening, fixed three settings. Age is the most important comparability factor, body mass index is the additional factor, and a follow-up of at least five years with at least 90% retention counts as adequate.
| Item | What the paper reports (hypothetical) | Rating | Stars |
|---|---|---|---|
| Selection 1. Representativeness of exposed cohort | Night-shift staff from six hospitals in one region, not volunteers | Somewhat representative | 1 |
| Selection 2. Non-exposed cohort | Day-shift staff from the same hospitals | Same community | 1 |
| Selection 3. Ascertainment of exposure | Shift pattern taken from payroll rosters | Secure record | 1 |
| Selection 4. Outcome absent at start | No baseline screening or history of diabetes reported | Not demonstrated | 0 |
| Comparability | Hazard ratio adjusted for age and body mass index | Most important factor plus additional factor | 2 |
| Outcome 1. Assessment | Diabetes identified by linkage to a national registry | Record linkage | 1 |
| Outcome 2. Follow-up long enough | Median follow-up 7.2 years against the 5-year protocol rule | Yes | 1 |
| Outcome 3. Adequacy of follow-up | 82% retained, and those lost are not described | Below 90% with no description | 0 |
| Total | 7 of 9 |

The total of 7 hides two separate gaps. The paper never says whether participants were free of diabetes at baseline, and it does not describe the 18% who left the study. Item-level reporting shows a reader exactly where the evidence is thin, which a bare “7/9” does not.
Now see how fragile a category can be. The table applies the Agency for Healthcare Research and Quality conversion described in the next section to three plausible single-item disagreements between raters.
| Scenario | Selection | Comparability | Outcome | Total | Category under the AHRQ conversion |
|---|---|---|---|---|---|
| Rater A as scored above | 3 | 2 | 2 | 7 | Good |
| Rater B reads the night-shift cohort as a “selected group” (no star on Selection 1) | 2 | 2 | 2 | 6 | Fair |
| Rater C finds the registry lacks validation and withholds the Outcome 1 star | 3 | 2 | 1 | 6 | Poor |
One star moved the same study from Good to Fair or to Poor. That is arithmetic on a published convention, not an empirical finding, but it explains why two independent raters and a written disagreement rule are worth the effort. Hartling and colleagues measured how often raters actually diverge, and their figures appear in the limitations section below.
Turning Stars Into Good, Fair or Poor Is a Convention
The Ottawa manual and rating sheets contain no pass mark. They tell you how to award stars and stop there. The labels you see in published reviews come from conversions that review authors add themselves, and one conversion attached to the NOS in published reviews is described as a conversion to the standards of the Agency for Healthcare Research and Quality (AHRQ). Esmailian et al. (2026, PMID 42006405) label it that way, and Heera and Babu (2025, PMID 40756036) apply the same thresholds.
| Convention | Rule | Where it appears |
|---|---|---|
| AHRQ conversion, “Good” | 3 or 4 stars in Selection AND 1 or 2 stars in Comparability AND 2 or 3 stars in Outcome/Exposure | Esmailian et al. 2026; Heera and Babu 2025 |
| AHRQ conversion, “Fair” | 2 stars in Selection AND 1 or 2 stars in Comparability AND 2 or 3 stars in Outcome/Exposure | Same reviews |
| AHRQ conversion, “Poor” | 0 or 1 star in Selection OR 0 stars in Comparability OR 0 or 1 star in Outcome/Exposure | Same reviews |
| NOS-xs (cross-sectional adaptation) | 0 to 3 stars high risk of bias, 4 to 6 moderate, 7 to 9 low | Carra et al. 2026, for the authors’ own adapted tool |
Notice the structure of the AHRQ rule. It looks at each domain, not at the grand total, so a study with 7 stars can still be Poor if one domain collapses. The NOS-xs bands, by contrast, work on the total, and they belong to a new adapted tool rather than to the original NOS. Because none of these cut-offs is part of the scale, state the one you use in the protocol and cite who defined it.
A Real Example of Newcastle-Ottawa Scale Scoring on a Published Cohort Study
The hypothetical study above shows the mechanics. A published paper shows what the same eight decisions look like when the evidence sits in real Methods text and real tables. This section scores one open-access cohort study with the cohort rating sheet, one item at a time, and points to the part of the paper where each answer is found. It is illustrative Editverse scoring for teaching and not a judgement on the authors or on the quality of their work.
The Study Scored in This Example
Citation. Jørgensen H, Horváth-Puhó E, Laugesen K, Brækkan S, Hansen JB, Sørensen HT. Risk of a permanent work-related disability pension after incident venous thromboembolism in Denmark: a population-based cohort study. PLoS Med. 2021;18(8):e1003770. doi:10.1371/journal.pmed.1003770. PMID 34464405. PMCID PMC8443033.
Licence. Creative Commons Attribution 4.0 (CC BY 4.0), confirmed on the version of record in Crossref metadata and on the publisher and PubMed Central article pages. Short quotations and one figure are reused below under that licence, with attribution.
Why this paper. It is a nationwide Danish cohort of 43,769 people with incident venous thromboembolism (VTE) and 218,845 matched members of the general population, built from linked national registers, and it states that it is reported under STROBE. The design, an exposed group compared with matched general-population members and followed through registers, is one a systematic reviewer can meet in any question about a disease or exposure. Because the full text is open, every row of the table can be checked against the source.
Label. Illustrative Editverse scoring for teaching, not a judgement on the authors. Other raters using the same sheet may differ on the rows marked as judgement calls.
The review question and protocol settings assumed
NOS comparability depends on the review question, so the question has to be fixed before any star is counted. Assume a review that asks whether, in adults of working age, an incident hospital-diagnosed VTE is associated with later permanent loss of work capacity, measured as receipt of a disability pension. The protocol for that review sets age as the most important comparability factor, comorbidity and socioeconomic status as additional factors, and a median follow-up of at least 3 years as adequate. All three settings are written before screening, as the coding manual rules require.
Star-by-star scoring against the cohort rating sheet
The option letters in the reasoning column follow the cohort rating sheet of the Ottawa Hospital Research Institute, and the reasoning applies the coding manual. Section and table pointers refer to the open-access article.
| NOS item | What the paper reports (where to find it) | Stars | Reasoning from the sheet and manual |
|---|---|---|---|
| Selection 1. Representativeness of the exposed cohort | All hospital inpatients and outpatients aged 25 to 66 with a primary or secondary diagnosis of deep vein thrombosis or pulmonary embolism in the Danish National Patient Registry, 1995 to 2016 (n = 43,769). Diagnoses made only in emergency departments were excluded. Methods, “VTE cohort”; Results. | 1 | Option (a) “truly representative” or option (b) “somewhat representative”, and both earn the star. Capture is nationwide in a tax-funded system, with no volunteer, membership or employer filter. The manual asks about people with the exposure, here VTE patients, and not about the general population. |
| Selection 2. Selection of the non-exposed cohort | Up to 5 people per VTE patient drawn from the Civil Registration System and matched on sex, birth year and calendar year (n = 218,845). In the authors’ words, “up to 5 individuals from the general population were randomly matched on sex, year of birth, and calendar year”. Methods, “General population comparison cohort”. | 1 | Option (a), drawn from the same community as the exposed cohort. Both groups come from one national population and one registry framework. |
| Selection 3. Ascertainment of exposure | VTE identified from ICD-10 hospital diagnoses in the registry. The Discussion cites a validation study with positive predictive values of 86% for deep vein thrombosis and 90% for pulmonary embolism. Methods, “VTE cohort”; Discussion. | 1 | Option (a), secure record. The data are hospital records and not participant recall. The ascertainment item of the cohort sheet has no record-linkage option, so a validated hospital registry sits under secure record. |
| Selection 4. Outcome not present at start | The authors “excluded individuals already receiving a work-related disability pension”, and also anyone who received one in the same or previous calendar year as the index date. The same rule applied to comparison members. Methods, “VTE cohort” and “Outcome”. | 1 | Option (a), yes. The manual says a statement of no history of the outcome earns the star, and here the absence is built into the cohort definition for both groups. |
| Comparability. Cohorts comparable by design or analysis | Matching on sex, birth year and calendar year, with Cox models stratified by age group and sex. Model 3 adds a socioeconomic index, obesity, cancer, coronary heart disease, diabetes, stroke, COPD, kidney disease, recent surgery and a Charlson score. Hazard ratio 3.0 (95% CI 2.8 to 3.1) in Model 1 and 2.3 (95% CI 2.2 to 2.4) in Model 3. Methods, “Statistical analysis”; Table 2. | 2 | The manual accepts matching in the design and adjustment in the analysis, and treats groups as comparable on each variable used in an adjusted ratio. Age is the protocol’s most important factor and earns the main-factor star through matching and stratification, while comorbidity and socioeconomic status are additional factors and earn the additional-factor star. Judgement call The stars follow the factors your protocol names, not the factors the paper happens to adjust for. |
| Outcome 1. Assessment of outcome | Receipt of a permanent work-related disability pension taken from the Integrated Database for Labour Market Research at Statistics Denmark, ascertained annually. Methods, “Outcome”. | 1 | Option (b), record linkage. The sheet gives a star for independent blind assessment or for record linkage, and an administrative register extract is record linkage with no self-report. |
| Outcome 2. Follow-up long enough for outcomes to occur | 13,652 pensions (5.2%) during a median overall follow-up of 4.9 years, with follow-up running to the end of 2016. Cumulative incidence is plotted for up to 15 years, and the 5-year figures are 11.8% (ages 45 to 54) and 9.2% (ages 35 to 44). Results; the authors’ Fig 1, shown below as Figure 3. | 1 | Option (a), yes, against the 3-year rule fixed in the protocol. The authors explain that a pension rarely follows work directly, because most people pass through sick leave and work-capacity measures before a pension is granted, which is why a minimum length was set. Judgement call A protocol that fixed 5 years as the minimum median would sit just under at 4.9 years. That is why the manual asks for the length to be decided before assessment begins. |
| Outcome 3. Adequacy of follow-up | Every resident is tracked through a personal identifier, which the authors say allows “accurate censoring due to emigration or death”. Members are censored at emigration, death, age 66 or the end of 2016, and all 43,769 exposed and 218,845 comparison members enter the analysis. Methods, “Design and setting” and “Statistical analysis”; Table 2. | 1 | Option (a), complete follow-up with all subjects accounted for. The paper prints no count of people lost, because the registry system follows residents by design. Judgement call A rater who wants an explicit loss figure in the text could choose option (b) instead, which earns the same star. |
| Total | Selection 4 of 4, Comparability 2 of 2, Outcome 3 of 3. | 9 of 9 | Under these protocol settings no item of the sheet is left unstarred. |
Three rows carry a judgement call badge because the star depends on a setting the review team chooses and not on the paper alone. Comparability depends on which factors the protocol names. The follow-up row depends on the minimum length, and the adequacy row depends on how a rater treats a registry that tracks every resident. The other four rows follow directly from the sheet wording, although Selection 3 rests on treating a validated hospital registry as a secure record.
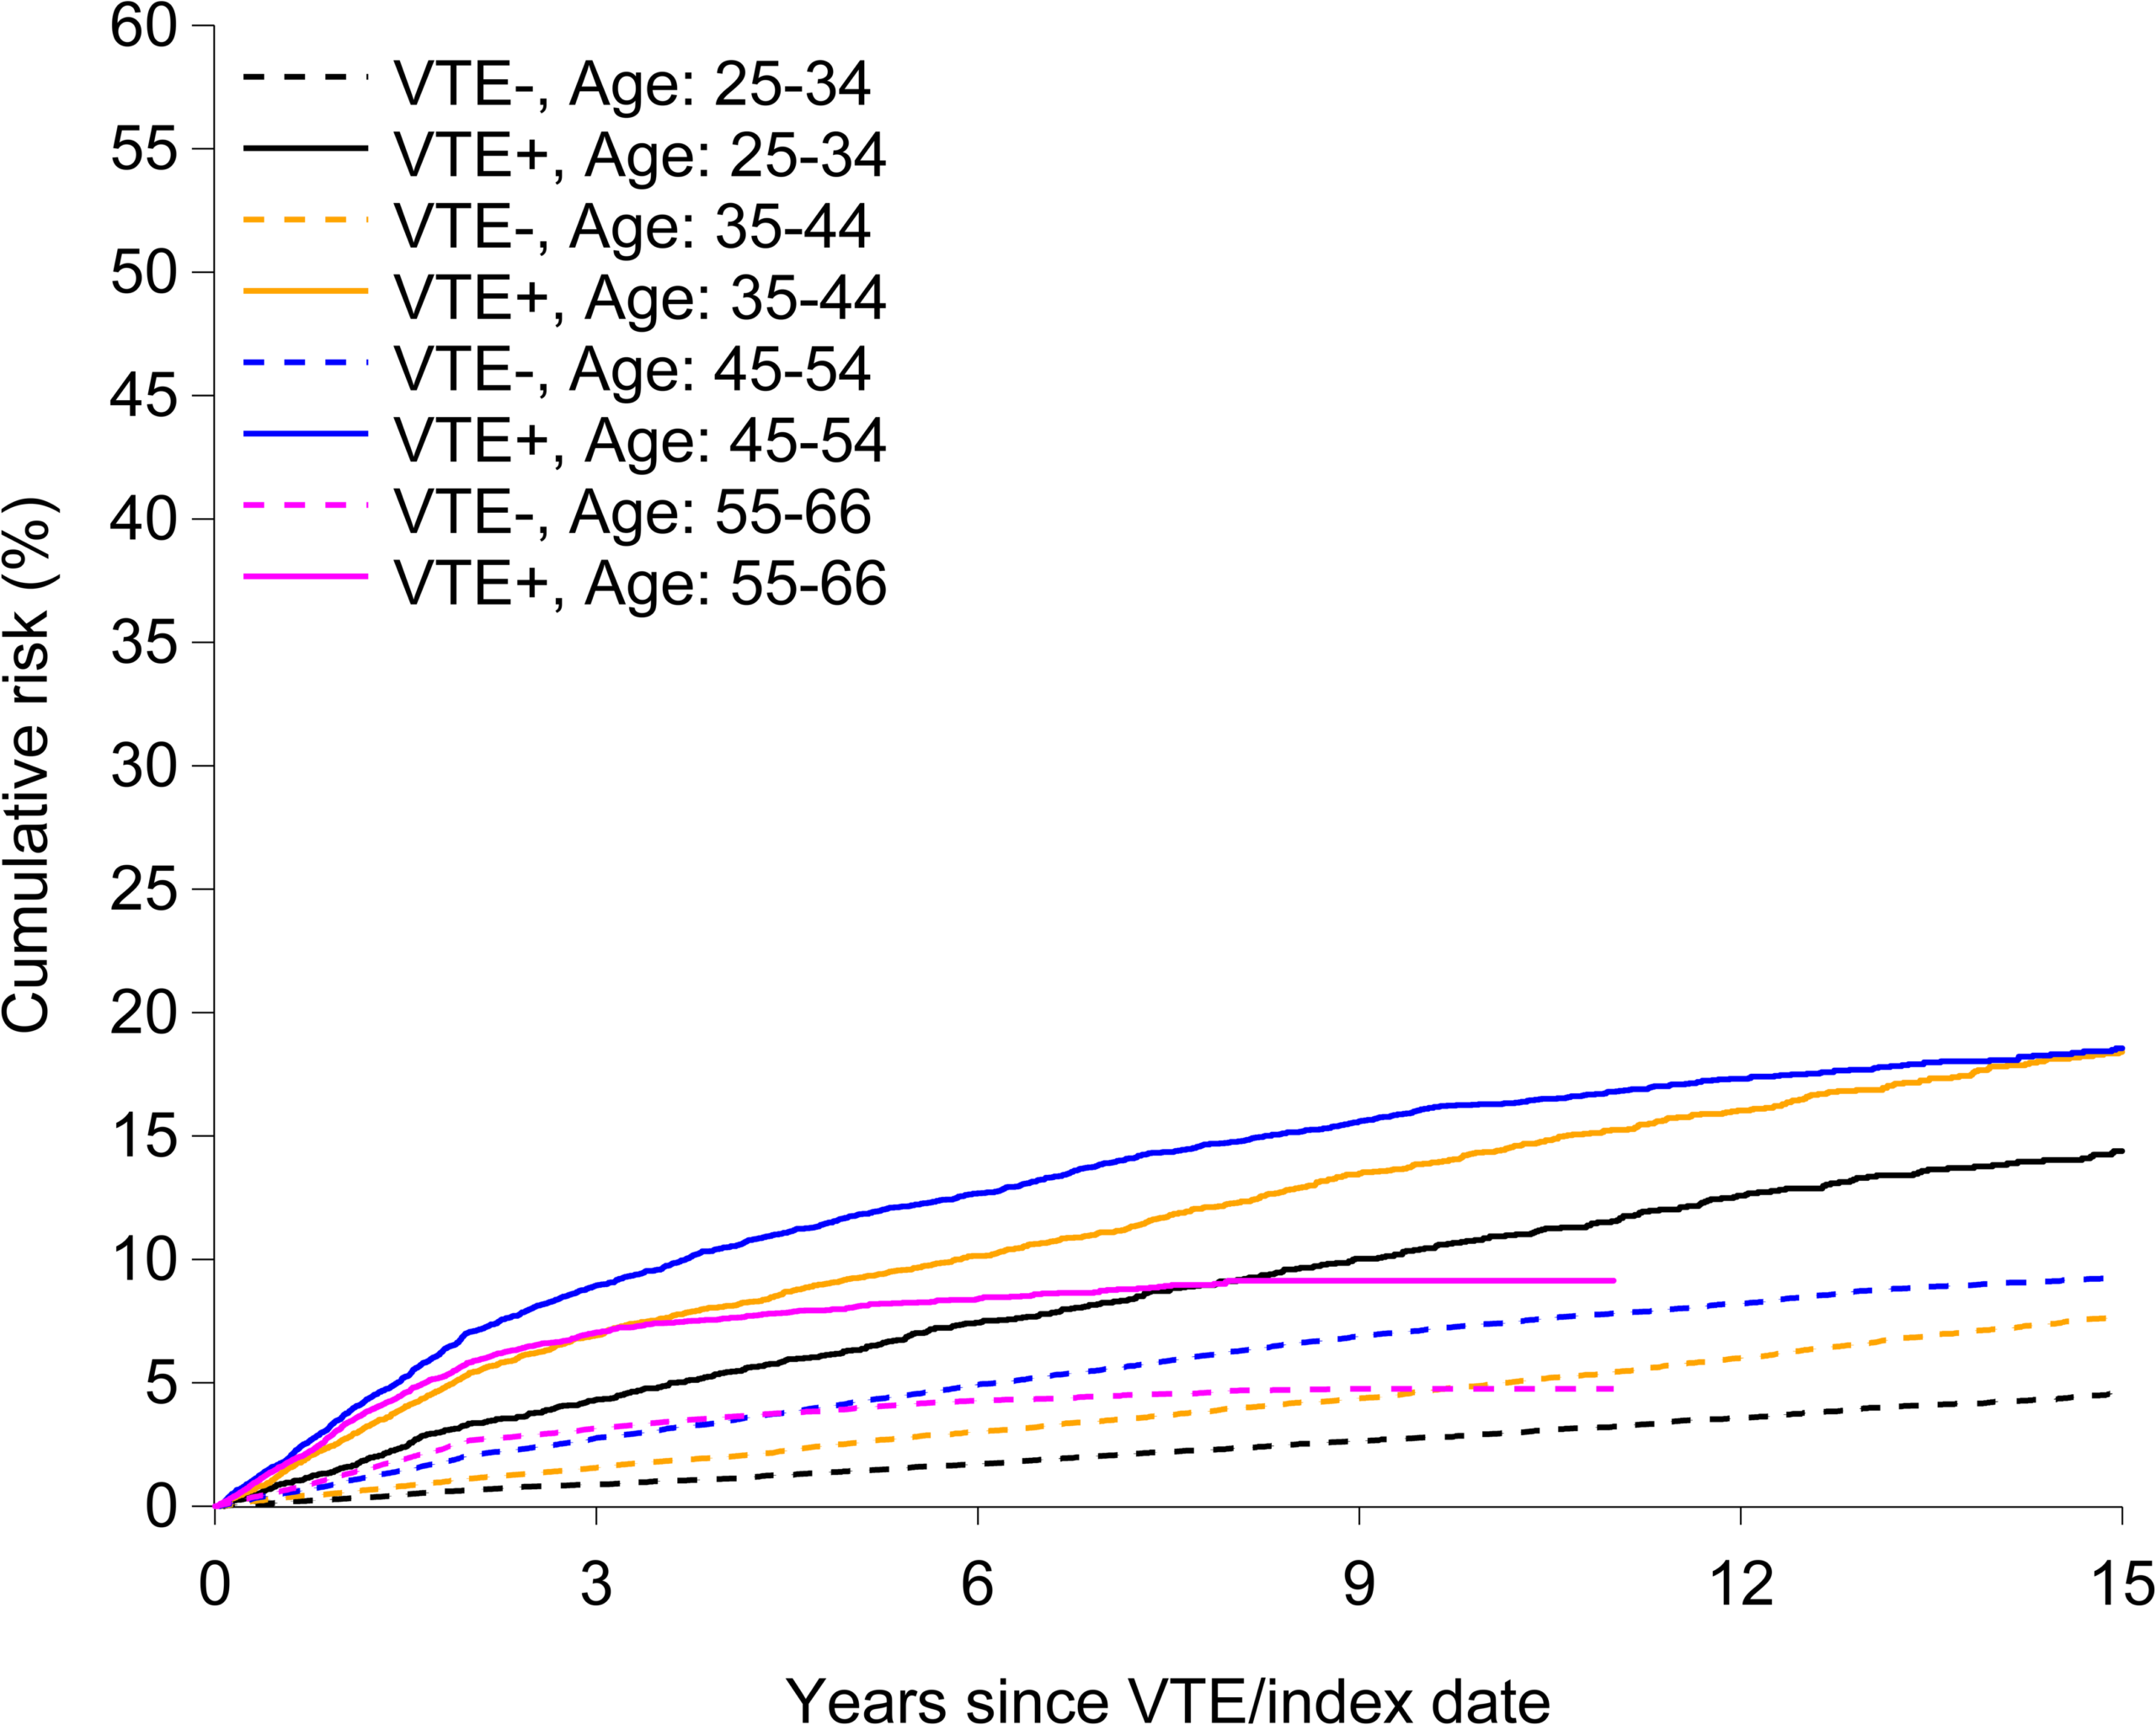
The Good, Fair or Poor label is a separate convention
The Ottawa documents give no pass mark, so the label below is a second step that a review team chooses to add. The AHRQ conversion described earlier, as applied by Esmailian et al. (2026) and Heera and Babu (2025), checks each domain and not the grand total. Selection 4, Comparability 2 and Outcome 3 meet the “Good” rule of 3 or 4 stars, 1 or 2 stars and 2 or 3 stars. The second row of the table shows how a stricter rater would score the same paper.
| Scenario | Selection | Comparability | Outcome | Total | Category under the AHRQ conversion |
|---|---|---|---|---|---|
| Scored as above | 4 | 2 | 3 | 9 | Good |
| Stricter rater whose protocol names occupational physical demand as the most important factor (no register data on it, so one comparability star) and requires a 5-year median follow-up (no Outcome 2 star) | 4 | 1 | 2 | 7 | Good |
Two stars disappeared in the second scenario and the category did not change. In the hypothetical night-shift example earlier on this page, a single star moved a study between categories. Which pattern appears depends on where the stars are lost, and that is a reason to report stars by item and not only the total.
What a 9 of 9 does and does not tell you
A total of 9 means the sheet found no visible design weakness in the items it asks about. It does not mean the estimate is free of bias. The authors write that “residual confounding due to unmeasured factors cannot be completely ruled out” (Discussion), and they name individual health behaviour and workplace factors as information the registers lack. The sheet has no item that takes such a statement into account, so a reviewer who wants that information in the synthesis has to record it separately, for example in a sensitivity analysis by domain.
The paper reports its design under the STROBE guideline, which is one reason each row above could be answered from the text without writing to the authors. Our STROBE guidelines tutorial for observational studies lists what a cohort paper needs to report. In a supplementary appraisal table this study would take one line, with Selection 4, Comparability 2, Outcome 3 and a total of 9, next to the three protocol settings that produced those stars.
How to Report the Newcastle-Ottawa Scale in a Systematic Review
A reader should be able to repeat your appraisal. A reporting block that does the job has five parts.
- Version and source. Name the cohort or case-control version, cite Wells et al. with the Ottawa Hospital Research Institute page, and say whether you used the sheet unmodified.
- Protocol settings. Report the “most important” and “additional” comparability factors, the minimum follow-up length, and the retention threshold, each fixed before screening.
- Raters and disagreement handling. Give the number of raters, whether they worked independently, and how conflicts were resolved. Published reliability studies used two reviewers (Hartling) and six raters (Kalaycioglu), so two independent raters with a stated tie-break rule is a defensible minimum.
- Item-level table. Show stars per item for every included study, in the main text or a supplement, rather than only totals.
- Use of the scores. Say whether you describe, subgroup or run sensitivity analyses by quality, and state any category threshold with its source.
Here is a methods sentence you can adapt. “Two reviewers independently appraised each cohort study with the Newcastle-Ottawa Scale (cohort version; Wells et al., Ottawa Hospital Research Institute), awarding up to nine stars across selection, comparability and outcome. Age was predefined as the most important comparability factor and body mass index as the additional factor; follow-up of at least five years and retention of at least 90% were predefined as adequate. Disagreements were resolved by discussion with a third reviewer. Studies were classified as good, fair or poor using the AHRQ conversion thresholds.”
When a paper is silent on an item, you can write to the authors. Lo and colleagues compared reviewer scores with scores supplied by the authors themselves and concluded that contacting authors is needed for information that studies do not publish. Where you do not hear back, record the item as not reported, not as a failure of the study. Reporting the same appraisal in a manuscript is easier when the underlying paper also follows reporting guidance, which is the subject of our STROBE guidelines tutorial for observational studies.
Known Limitations of the Newcastle-Ottawa Scale in the Literature
The scale is widely applied, and it has also been examined critically. The points below are what the published studies report, with their numbers.
Arbitrary item definitions and a misquoted critique
Stang (2010, European Journal of Epidemiology, volume 25, pages 603-605) published a critical evaluation of the NOS. A later analysis by Stang, Jonas and Poole (2018) describes that commentary as criticising the scale for arbitrary definitions of quality items. They examined a random sample of 100 papers citing it, of which 96 were systematic reviews. None quoted the commentary directly, and all but 2 of the 96 indirect quotations (98%) portrayed it as supporting the use of the NOS when the opposite was the case. The commentary had been cited 1,250 times through December 2016. The practical lesson is to read the critique before citing it, and to cite it accurately.
Reliability between raters
Hartling and colleagues had two reviewers apply the NOS to 131 cohort studies from eight meta-analyses. Agreement ranged from substantial for length of follow-up (kappa 0.68) to poor for selection of the non-exposed cohort (kappa -0.03) and for demonstration that the outcome was absent at the start (kappa -0.06). Overall-score reliability was fair (kappa 0.29, 95% confidence interval 0.10 to 0.47). The reviewers found the tool difficult to use and the decision rules vague, and the study found no association between individual items or the overall score and effect estimates. Notice that the two poorest items are items 2 and 4 of the cohort selection block used in the worked example above.
Dependence on what authors chose to report
Lo, Mertz and Loeb compared NOS scores from the reviewers of a published systematic review with scores completed by study authors for the same cohort studies. Authors of 65 of 182 studies (36%) responded. The median overall score was 6 (interquartile range 6 to 6) for reviewers and 5 (interquartile range 4 to 6) for authors, a significant difference (p below 0.001), and agreement on the overall score was poor (kappa -0.004). Item-level agreement ranged from slight (kappa 0.15) to poor (kappa -0.06).
Results are not uniformly poor
Kalaycioglu and colleagues had six raters assess 30 exposure studies with each of three tools, rating them as low, intermediate or high risk of bias. All tools, including the NOS, reached substantial inter-rater reliability (intraclass correlation 0.61 to 0.80), while the SIGN50 checklist reached almost perfect agreement. The authors note that tools with fewer and simpler criteria may yield more reliable assessments. Taken with the studies above, the fair reading is that reliability depends on the rating design, the training of raters, and the way scores are collapsed into categories.
Scope
The NOS was written for cohort and case-control studies. Carra and colleagues proposed an adaptation for cross-sectional studies (NOS-xs, with a four-star variant for prevalence studies), which shows both the demand for a wider tool and the fact that the original does not cover that design. For non-randomised studies of interventions, chapter 25 of the Cochrane Handbook (version 6.5, 2024) describes ROBINS-I as the tool for assessing risk of bias, and frames it as a framework for assessing a single result.
NOS vs ROBINS-I vs JBI: A Decision Table
Choosing a tool is mostly a question of what your review asks and which design the included studies used. The descriptive rows below come from the sources named in the last column. The “pick it when” row is Editverse’s own decision rule, offered as practical guidance and not as a published standard.
| Feature | Newcastle-Ottawa Scale | ROBINS-I | JBI critical appraisal checklists |
|---|---|---|---|
| Built for | Nonrandomised studies, with cohort and case-control versions | Risk of bias in estimates of comparative effectiveness (harm or benefit) of interventions, from studies that did not randomise | One checklist per study design, including cohort, case control, analytical cross-sectional, prevalence and quasi-experimental |
| Output | Stars, up to 9 per study | Risk-of-bias judgement for a single result | Item-by-item checklist answers per study |
| Source | Wells et al., Ottawa Hospital Research Institute | Sterne et al., BMJ 2016; Cochrane Handbook chapter 25 | JBI critical appraisal tools page |
| Pick it when | Your protocol or target journal names the NOS, and the question is about an exposure in cohort or case-control studies | The question is the effect of an intervention and the included studies are non-randomised comparisons | The review mixes several designs and you want one checklist family across them, or includes prevalence studies |
| Your review question | Design of included studies | Tool to consider first |
|---|---|---|
| Effect of an intervention | Non-randomised comparison | ROBINS-I |
| Effect of an environmental, occupational or behavioural exposure | Non-randomised follow-up studies | ROBINS-E (Higgins et al. 2024), or the NOS cohort version if your protocol names it |
| Risk factor or exposure association | Case-control | NOS case-control version, or the JBI case control checklist |
| Association from a single survey | Analytical cross-sectional | JBI analytical cross-sectional checklist, or the NOS-xs adaptation |
| Prevalence | Prevalence studies | JBI prevalence checklist, or NOS-xs2 |
If the target journal or guideline panel names a tool, use that one and justify any addition. Our ROBINS-I tool guide covers the domain-based alternative in detail.
Frequently Asked Questions
How many stars can a study earn on the Newcastle-Ottawa Scale?
Up to nine in either version, made of 4 Selection stars, 2 Comparability stars, and 3 Outcome stars (cohort) or Exposure stars (case-control).
Is there an official cut-off for a good NOS score?
No. The Ottawa manual and rating sheets give none. Reviews apply their own conversions, such as the AHRQ good, fair and poor thresholds, and should cite the source.
Can I use the NOS for randomised trials or cross-sectional studies?
The scale was written for non-randomised cohort and case-control studies. Randomised trials use other tools, and a cross-sectional adaptation (NOS-xs) has been proposed by Carra and colleagues.
Should the NOS total be used to weight studies in a meta-analysis?
Hartling and colleagues tested validity directly and found no association between individual items or the overall score and effect estimates. Reporting item-level results and checking sensitivity by domain is easier to defend than weighting by stars.
Free Research Tools from Editverse
- GraphPro: build publication-ready charts, 25 types, with built-in t-test, ANOVA, correlation, and chi-square p-values. Free, no signup.
- StatPro: free statistical calculators and a test-selector tool covering group comparisons, categorical outcomes, time-to-event analysis, and diagnostic accuracy.
- Flowchart Pro: generate PRISMA 2020, PRISMA-ScR, CONSORT, STROBE, STARD, MOOSE, and ARRIVE flow diagrams directly in your browser.
Professional Support for Newcastle-Ottawa Scale Appraisal in Your Review
Choosing the tool, fixing the protocol settings, and training raters to apply them the same way are the steps that decide whether a Newcastle-Ottawa Scale table survives peer review. Editverse methodologists set these decisions up with you, work in alignment with COPE, ICMJE and GPP 2022, and follow institutional and country-specific requirements. The packages below match the stage your review is at.
Protocol
$500
PROSPERO-ready protocol with PICO framework, search strategy and risk of bias tool selection. 2-3 weeks.
Full review
$1,800
Systematic review plus meta-analysis for up to 15 eligible studies, with quality assessment and risk of bias figures. 10-14 weeks.
Analysis only
$1,000
Meta-analysis from your extracted data, with forest plots, heterogeneity and sensitivity analysis. 2-3 weeks.
If your protocol is already written and your included studies are extracted, the standalone analysis package is the fastest route to a sensitivity analysis by quality domain. If you want one team to carry the review from protocol to manuscript, the Complete SR + Meta-Analysis package covers quality assessment and risk of bias figures along the way.
Conclusion
The Newcastle-Ottawa Scale turns a study’s design features into at most nine stars, with a clear item list for cohort and case-control studies and a short coding manual that settles most edge cases. Its strengths are speed and familiarity. Its weaknesses, as the literature shows, are item definitions that critics call arbitrary, uneven agreement between raters, and a dependence on what authors report. Use it with protocol-fixed settings, two independent raters, item-level tables, and a stated source for any good, fair or poor label, and reach for ROBINS-I or a JBI checklist when your question or design calls for it.
References
- Wells GA, Shea B, O’Connell D, Peterson J, Welch V, Losos M, Tugwell P. The Newcastle-Ottawa Scale (NOS) for assessing the quality of nonrandomised studies in meta-analyses. Ottawa Hospital Research Institute. ohri.ca/programs/clinical_epidemiology/oxford.asp
- Stang A. Critical evaluation of the Newcastle-Ottawa scale for the assessment of the quality of nonrandomized studies in meta-analyses. Eur J Epidemiol. 2010;25(9):603-605. PMID 20652370. doi:10.1007/s10654-010-9491-z
- Stang A, Jonas S, Poole C. Case study in major quotation errors: a critical commentary on the Newcastle-Ottawa scale. Eur J Epidemiol. 2018;33(11):1025-1031. PMID 30259221. doi:10.1007/s10654-018-0443-3
- Hartling L, Milne A, Hamm MP, Vandermeer B, Ansari M, Tsertsvadze A, Dryden DM. Testing the Newcastle Ottawa Scale showed low reliability between individual reviewers. J Clin Epidemiol. 2013;66(9):982-993. PMID 23683848. doi:10.1016/j.jclinepi.2013.03.003
- Lo CK, Mertz D, Loeb M. Newcastle-Ottawa Scale: comparing reviewers’ to authors’ assessments. BMC Med Res Methodol. 2014;14:45. PMID 24690082. doi:10.1186/1471-2288-14-45
- Kalaycioglu I, Rioux B, Briard JN, Nehme A, Touma L, Dansereau B, Veilleux-Carpentier A, Keezer MR. Inter-rater reliability of risk of bias tools for non-randomized studies. Syst Rev. 2023;12:227. PMID 38057883. doi:10.1186/s13643-023-02389-w
- Sterne JA, Hernan MA, Reeves BC, et al. ROBINS-I: a tool for assessing risk of bias in non-randomised studies of interventions. BMJ. 2016;355:i4919. PMID 27733354. doi:10.1136/bmj.i4919
- Sterne JAC, Hernan MA, McAleenan A, Reeves BC, Higgins JPT. Chapter 25: Assessing risk of bias in a non-randomized study. In Higgins JPT, Thomas J, Chandler J, et al, eds. Cochrane Handbook for Systematic Reviews of Interventions, version 6.5. Cochrane; 2024. cochrane.org/authors/handbooks-and-manuals/handbook/current/chapter-25
- Higgins JPT, Morgan RL, Rooney AA, et al. A tool to assess risk of bias in non-randomized follow-up studies of exposure effects (ROBINS-E). Environ Int. 2024. PMID 38555664. doi:10.1016/j.envint.2024.108602
- Carra MC, Romandini P, Romandini M. Risk of bias evaluation of cross-sectional studies: adaptation of the Newcastle-Ottawa Scale. J Periodontal Res. 2026. PMID 40293188. doi:10.1111/jre.13405
- Esmailian A, Raki C, Han HC, Alasti M. The role of exercise in reducing vasovagal syncope recurrence: a systematic review and meta-analysis. Am J Prev Cardiol. 2026. PMID 42006405. doi:10.1016/j.ajpc.2026.101504
- Heera T, Babu R. Systematic review and meta-analysis comparing outcomes of reduction versus nonreduction pyeloplasty in children. J Indian Assoc Pediatr Surg. 2025. PMID 40756036. doi:10.4103/jiaps.jiaps_1_25
- JBI critical appraisal tools (checklists by study design). JBI. jbi.global/critical-appraisal-tools
- Jørgensen H, Horváth-Puhó E, Laugesen K, Brækkan S, Hansen JB, Sørensen HT. Risk of a permanent work-related disability pension after incident venous thromboembolism in Denmark: a population-based cohort study. PLoS Med. 2021;18(8):e1003770. PMID 34464405. doi:10.1371/journal.pmed.1003770
- Wells GA, Shea B, O’Connell D, et al. Newcastle-Ottawa Quality Assessment Scale, cohort studies rating sheet, and coding manual for cohort studies. Ottawa Hospital Research Institute. rating sheet (PDF), coding manual (PDF)