Leverage the power of scatter plots to enhance your academic papers. Our guide covers the when and how of using this essential data visualization.

Leverage the power of scatter plots to enhance your academic papers. Our guide covers the when and how of using this essential data visualization.

Elevate your research with network graph visualizations. Leverage our expertise to publish in high-impact journals and share your findings.
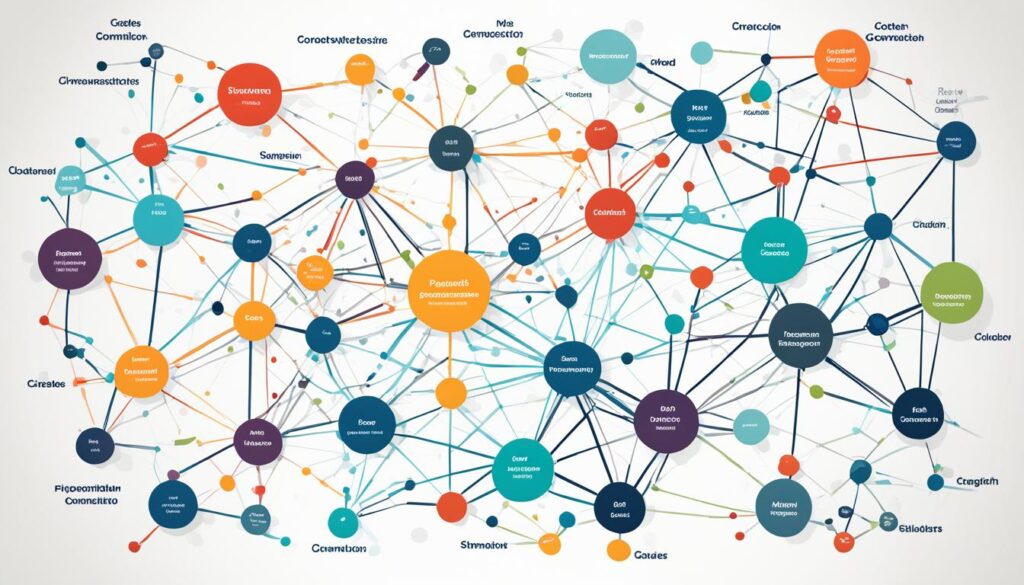
Discover how network graphs revolutionize data visualization, enabling researchers to uncover hidden connections and patterns in complex datasets. Learn to leverage this powerful tool.

Discover how box plots and whisker diagrams effectively visualize data distribution in research. Learn to interpret these powerful statistical tools for data analysis.

“The greatest problem of communication is the illusion that it has been accomplished.” – George Bernard Shaw. This quote is very true for academic research. In this field, complex scientific data needs to be made easy to understand and share. Looking ahead to 2024-2025, the need for data visualization tools is huge. These tools change complex data into easy-to-understand visuals. This helps researchers find insights…