
Discover how heatmaps revolutionize complex data visualization in research. Learn to leverage this powerful tool for insights across various fields and applications.

Discover how heatmaps revolutionize complex data visualization in research. Learn to leverage this powerful tool for insights across various fields and applications.
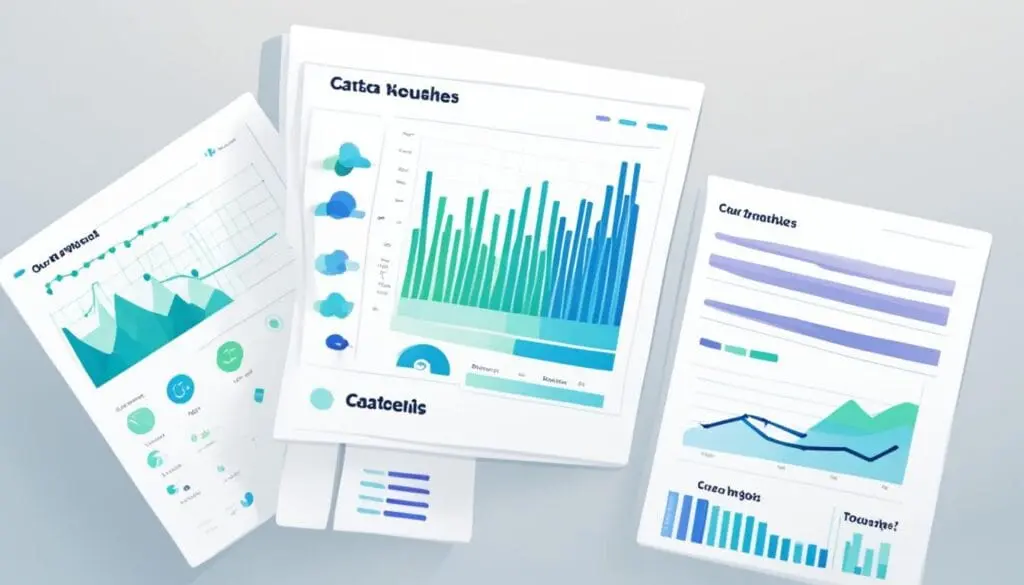
Discover how interactive graphs in digital publications boost reader engagement. We explore techniques to make your data come alive and captivate your audience.
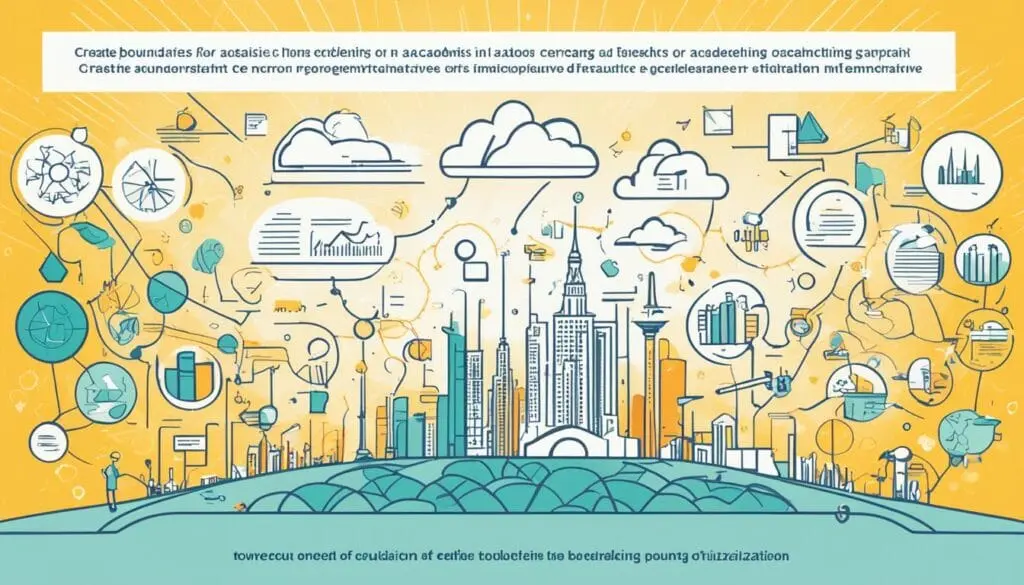
Explore innovative interdisciplinary graph types breaking visualization boundaries. Discover new ways to represent complex data across academic fields for 2024-2025.

Discover how network graphs revolutionize data visualization, enabling researchers to uncover hidden connections and patterns in complex datasets. Learn to leverage this powerful tool.

Explore how graph selection influences data interpretation through real-world research case studies. Uncover the power of Graph Choice Impact on Data Interpretation.