Compare and contrast bar charts and histograms, and uncover the optimal use cases for each in data presentation.
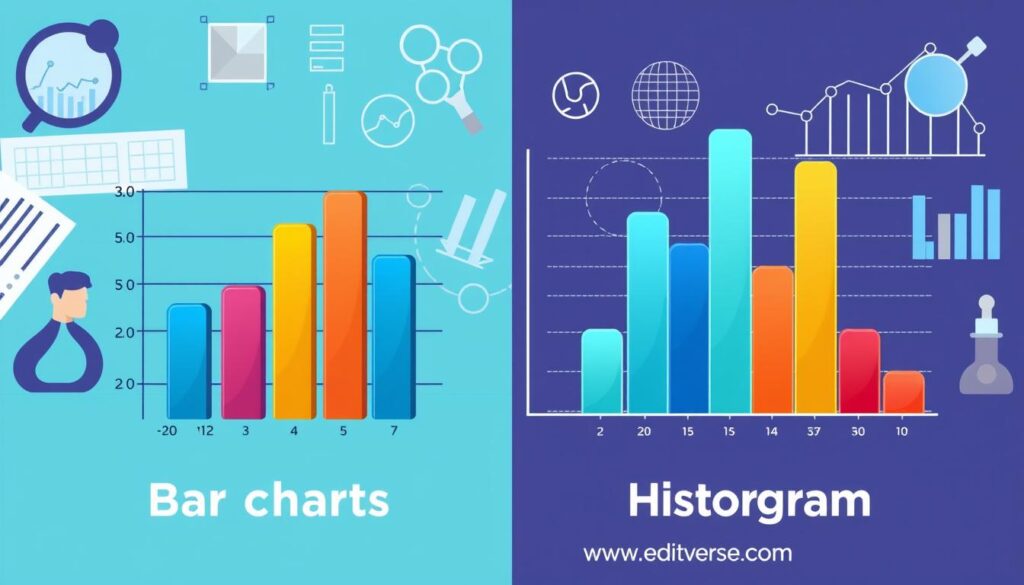
Compare and contrast bar charts and histograms, and uncover the optimal use cases for each in data presentation.

Discover essential strategies for nursing data analytics in healthcare settings. Learn how to leverage clinical data, improve patient outcomes, and enhance evidence-based practice

Streamline virtual lab reporting with our 2025 protocol – master data analysis and presentations for successful publication.
Discover how research impact, metrics drive academic excellence in Saudi Arabia. Learn measurement tools and strategies to enhance scholarly influence in the Gulf region

Explore how graph selection influences data interpretation through real-world research case studies. Uncover the power of Graph Choice Impact on Data Interpretation.