
A patent landscape analysis shows where patenting activity in a technology is concentrated, who is filing, how fast the field is growing and where few filings exist. Researchers use it to choose a research direction, to find potential collaborators and licensees, to write the impact and commercialisation sections of a grant, and to decide which of several inventions deserves protection first.
This guide explains what a patent landscape analysis is and is not, how to set its scope, how to count patents fairly, which statistics to report, and how to turn a search result into a chart. It follows the WIPO Guidelines for Preparing Patent Landscape Reports. If you want the analysis prepared for you, our patent documentation and search services include a landscape summary in the full technical file.
In Simple Words
A patent landscape analysis answers one question about a whole field: who is patenting what, where and since when. It does not tell you whether your invention is new (that is a prior art search), and it does not tell you whether you may sell a product (that is a freedom-to-operate opinion from a patent attorney).
Key takeaways
- Write the question first. The scope (countries, years, technology, family method) follows from it.
- Count patent families, not patent documents, so one invention filed in 20 countries counts once.
- Search for high recall first, then screen for relevance, because the two pull in opposite directions.
- Report a fixed set of statistics: families by year, national phase entries, grants, technology categories, first filing office, top applicants, top inventors, highly cited patents.
- A landscape is not a legal opinion. Freedom to operate stays with a patent attorney.
What a patent landscape analysis is, and is not
The WIPO guidelines say plainly that there is no single universally accepted definition of a patent landscape report. In general it provides an overview of the patenting activity and trends in a field of technology, normally to answer a specific policy or practical question, and presents complex information in a clear and accessible form. Industry has long used landscapes to make decisions on investment, research directions and competitors’ activity. The guidelines add that public policymakers now use them in fields such as health, food security and the environment.
Three different patent questions are often mixed up, and each needs a different analysis.
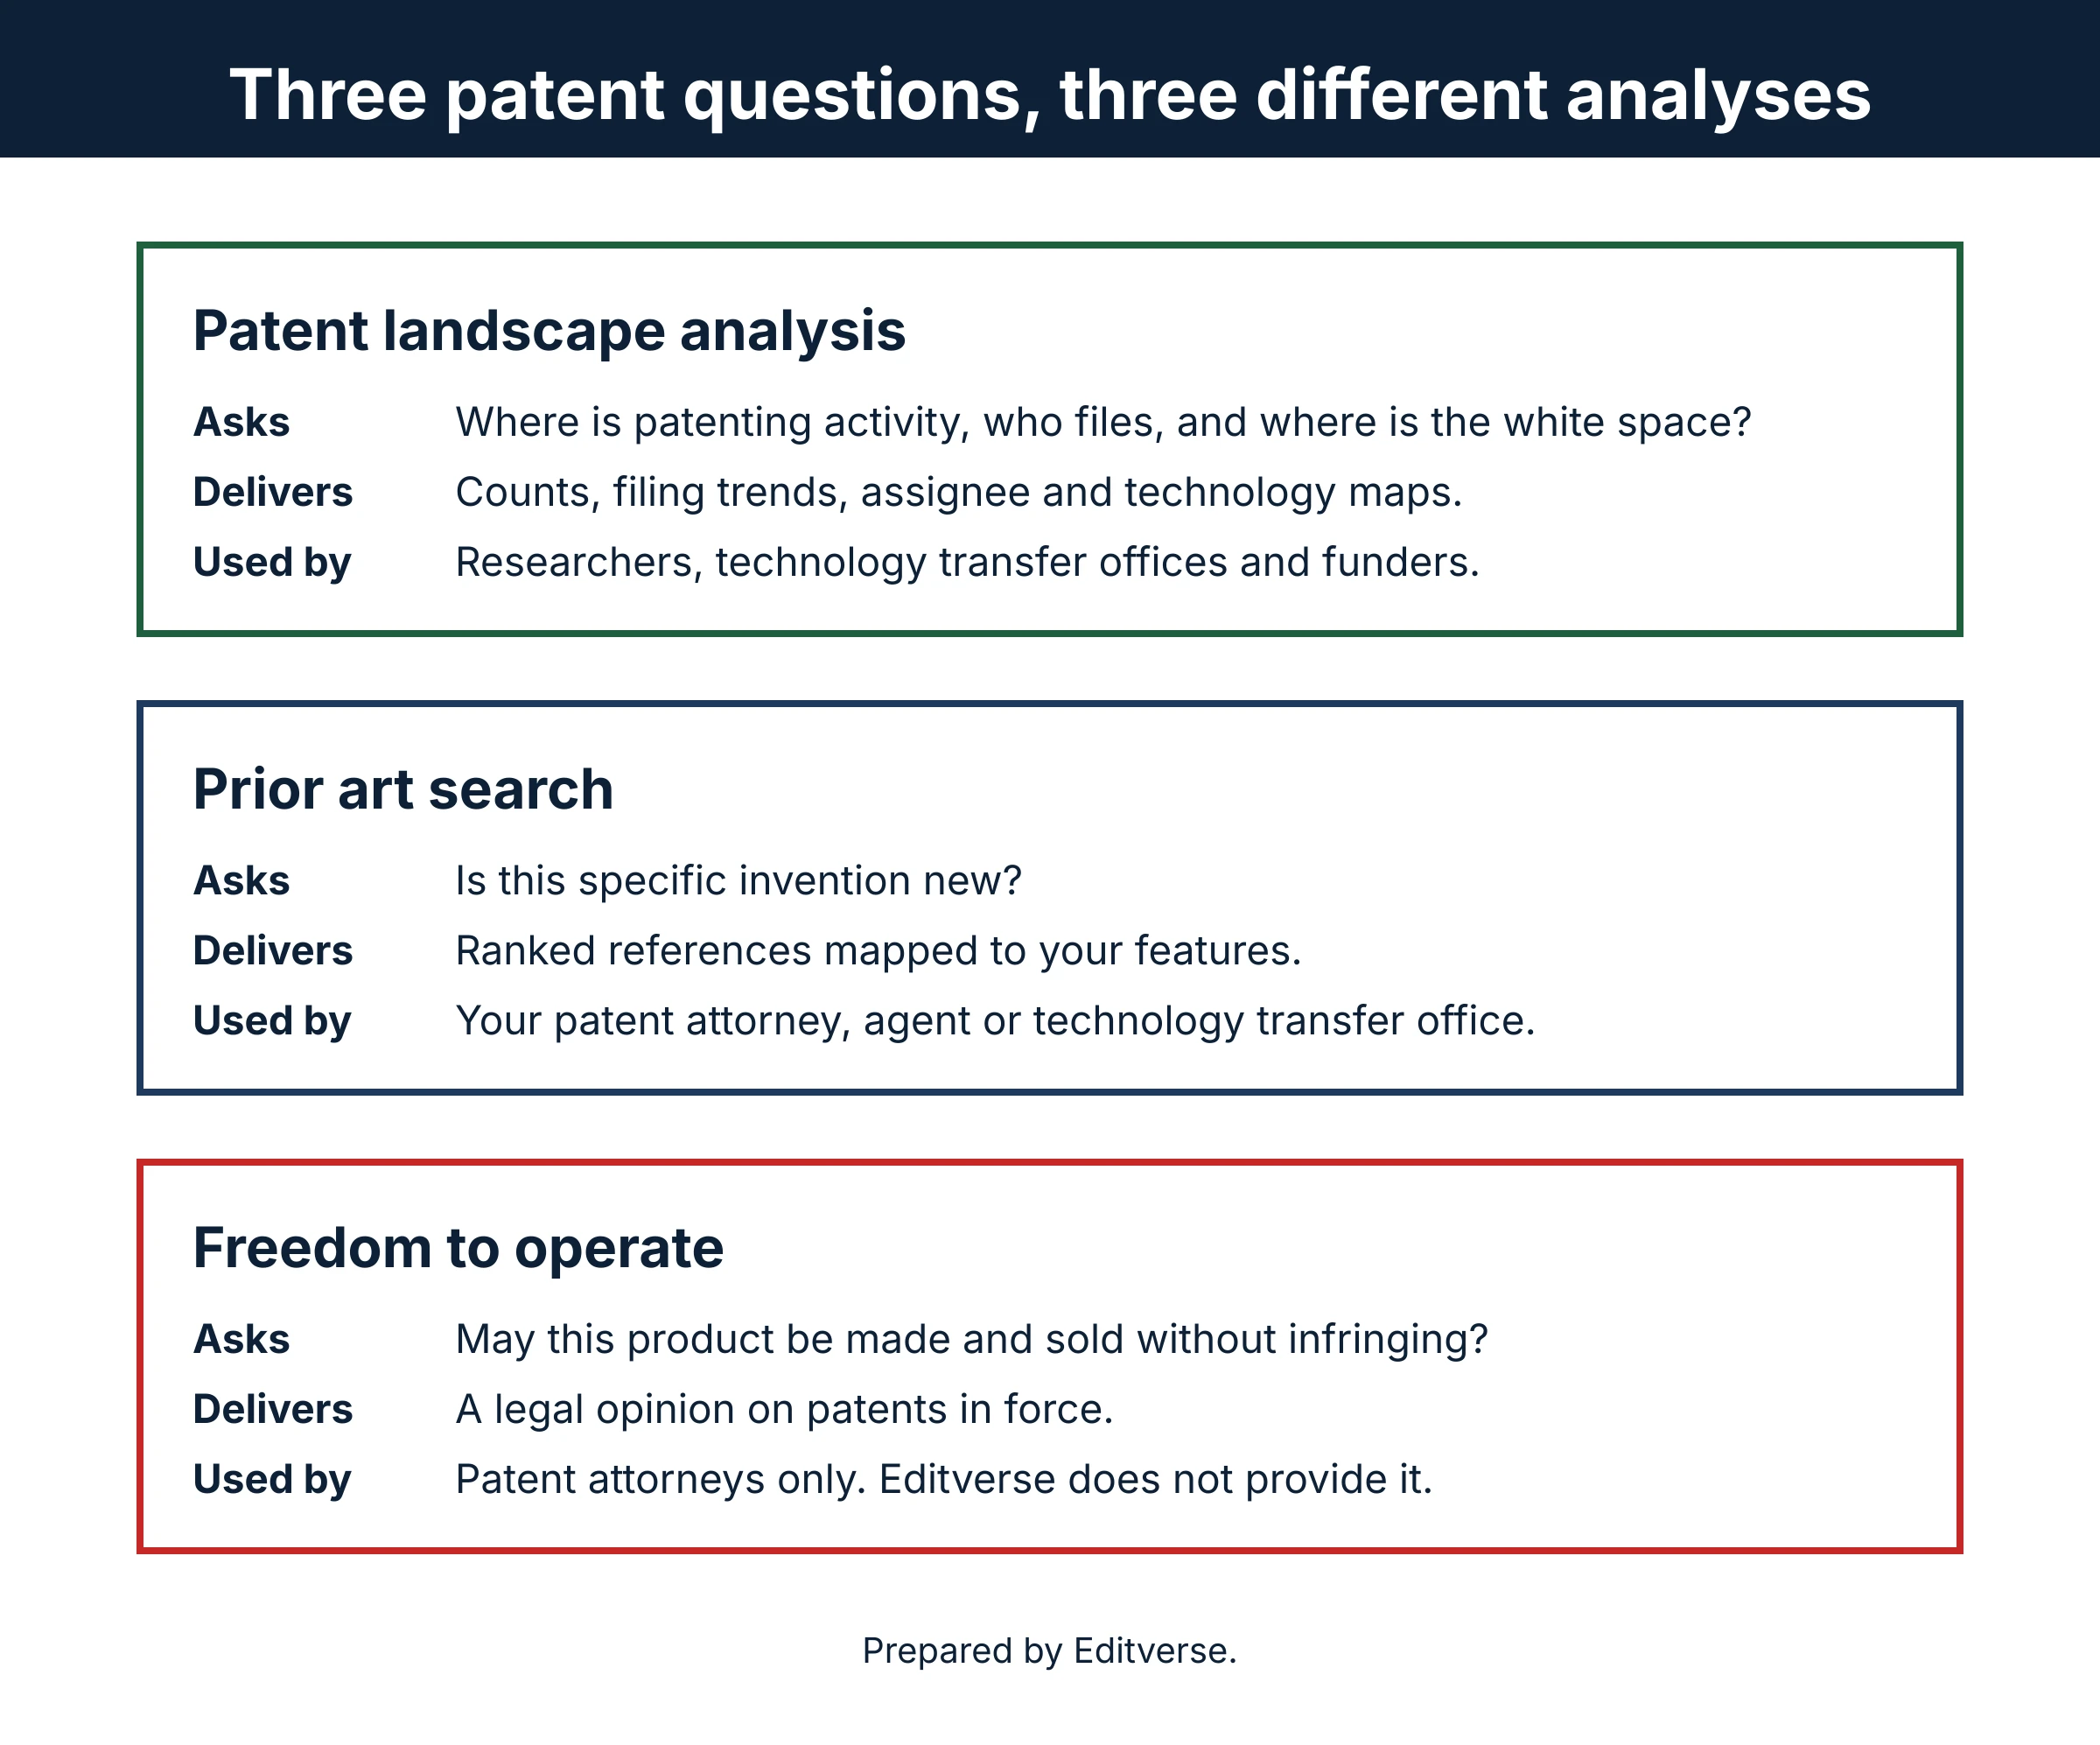
| Question | Analysis | Who needs it | What it covers |
|---|---|---|---|
| Where is the activity in this field, and who files? | Patent landscape analysis | Researchers, technology transfer offices, funders | Many patent families across a field, usually with a chart set |
| Is my invention new? | Prior art search | Your patent attorney, agent or TTO | Patent and non-patent literature published before the filing date, mapped to your features |
| May this product be sold without infringing? | Freedom to operate | A patent attorney | Country-specific, usually in-force granted patents and their claims |
The WIPO guidelines describe freedom-to-operate work the same way. It is country specific, usually applies to in-force granted patents and their claims, and is requested as a legal opinion before a product is launched. Editverse does not give that opinion. Our landscape work is technical documentation that a patent attorney can build on.
Why researchers run a patent landscape analysis
- Direction. A growing family count by year shows that interest in a topic is rising, a flat one that it has matured. The WIPO guidelines note that interest can also fall and then rise again when a new application is found.
- Partners. The guidelines point out that inventors who patent together with a university can be potential collaborators for organisations entering an industry, and that top applicants show who holds a high stake in the area.
- White space. Technology categories with few filings can show where an invention may be harder to anticipate. Treat that as a lead to check with a prior art search, not as proof of novelty.
- Grants and reports. Impact and commercialisation sections often need a statement of who else works in the area. A landscape gives you counts to cite.
- Portfolio choices. When several inventions compete for filing budget, a landscape shows which areas are crowded.
How to run a patent landscape analysis in seven steps
Step 1. Write the question and the decision it supports
Start with a sentence such as “Which groups file on solid-state hydrogen storage, and in which countries?” The WIPO guidelines warn that looking at everything would be like trying to boil the ocean and lead to a project that lacks direction, so the stated scope keeps the work on the business need and shows readers the constraints the analysis was done under.
Step 2. Set the country coverage
The guidelines tell you to include the countries that the conclusions will affect and the countries that will have an impact on the issues, for example where a product will be sold and where it will be made. They also advise including PCT documents, because a PCT application can designate many countries at once and a later national stage filing could give rights in a country of interest.
Step 3. Set the time period
The guidelines note that in almost all jurisdictions the natural term of a patent is 20 years from the priority filing, so analysts who study in-force patents tend to use a 20-year window. A shorter, recent window suits a fast-moving or new technology and is a way to split a very large collection. A historical study may use no limit at all to show how a field evolved.
Step 4. Choose how to count families
One invention can produce many documents. Reducing them to families stops a company that filed in 30 countries from looking busier than one that filed in two. The guidelines describe two common methods. A basic family groups documents with exactly the same priority or combination of priorities. An extended family, usually tied to the INPADOC database, also uses domestic application numbers as connecting elements. Basic families give more, narrower groups. Extended families give fewer, broader groups, and can under-represent how much an organisation invested. Pick one method and use it for the whole project.
Step 5. Search for high recall, then screen
Recall is how much of the useful information your search retrieved. Precision is how much of what you retrieved is useful. The guidelines say they usually pull in opposite directions: pushing recall up lets more off-topic records in. For a landscape it is usually more productive to start with a high-recall set and screen it afterwards. See our prior art search guide for the database list and query building, which apply here as well.
Step 6. Clean and screen the collection
Read titles, abstracts and claims to remove off-topic families. The guidelines also say that applicant and inventor names almost always need to be cleaned or grouped before statistics are run, since one organisation appears under many name spellings.
Step 7. Chart the statistics and write the findings
Report the standard set in the next section, label every chart with the scope and the counting method, and state what the data cannot show.
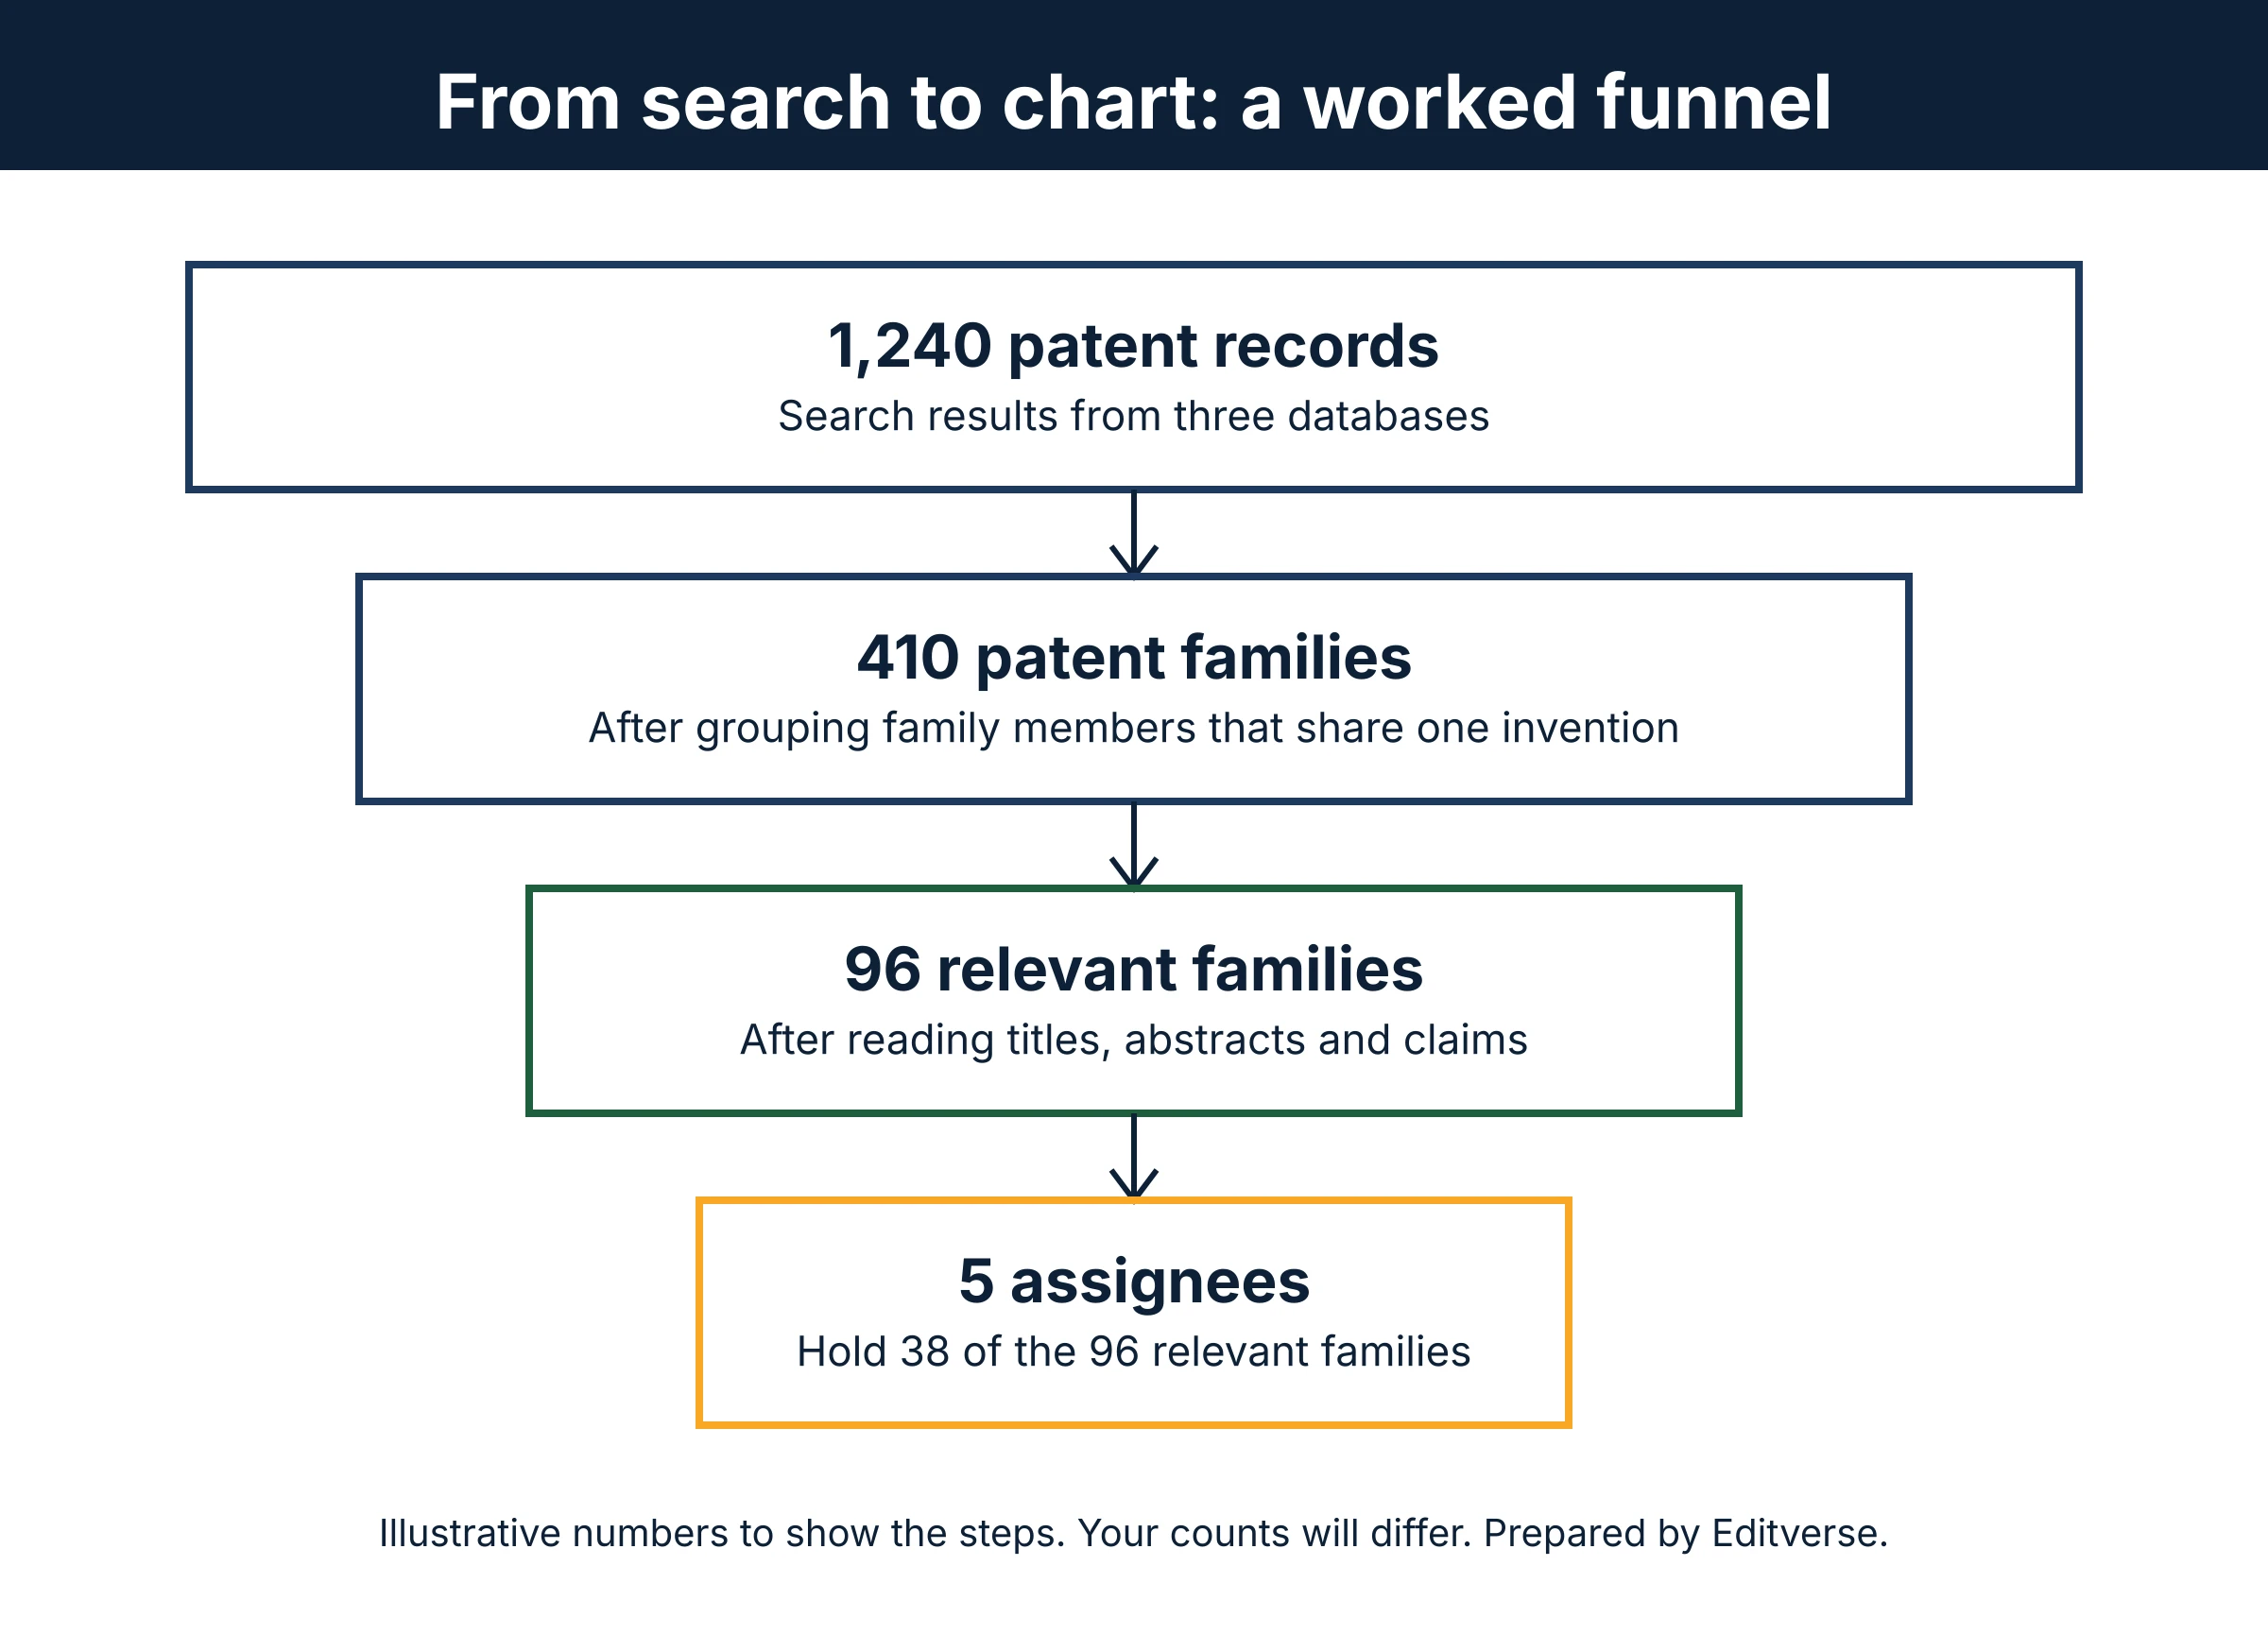
Worked example. A search across three databases returns 1,240 records. Grouping family members that share one invention leaves 410 families. Reading titles, abstracts and claims keeps 96 relevant families. Five assignees hold 38 of those 96. The finding is that the field is concentrated in a handful of owners, which is a different message from the 1,240 headline. These numbers are illustrative, not a real search.
The statistics a patent landscape analysis should report
The WIPO guidelines list a set of standard analyses. Using the same set makes your landscape comparable with others and tells readers what to expect.
| Statistic | What it shows | Typical chart |
|---|---|---|
| Number of families by year | Whether interest in a topic is growing, declining or static | Line or column chart by year |
| National phase entries | How widely protection was sought. Moving from a PCT application to national phase filings signals increased investment | Bar chart by country |
| Granted patents against pending | Only granted, in-force patents give the right to exclude, so this shows how much protection is in place now | Stacked bar by year |
| Technology categories or classes | Relative interest in different approaches to the same problem | Bar chart of categories |
| Office of first filing | The priority filing country approximates where the invention was likely created | Bar chart or map by country |
| Top applicants or assignees | Who has invested most in patenting. Names must be cleaned and grouped first | Bar or stacked bar |
| Top inventors | Thought leaders, potential collaborators or sources of expertise | Bar chart or table |
| Highly cited patents | Seminal documents that had a high impact on the technology | Table, or a timeline of key patents |
Choose the chart type for the message. A line chart suits a trend over years and a bar chart suits a ranking. Our free GraphPro chart builder produces publication-ready figures from a table of counts.
Pro tip. Put the scope in the caption of every chart: databases, date of the search, country coverage, time window and family method. A chart without them cannot be reproduced.
Where to run a patent landscape analysis
The data comes from patent databases. These free ones are worth knowing, and each has its own coverage and family handling, so check which one you use and record it.
| Database | Run by | Link |
|---|---|---|
| PATENTSCOPE | WIPO | patentscope.wipo.int |
| Espacenet | European Patent Office | epo.org |
| Patent Public Search | USPTO | uspto.gov |
| Google Patents | patents.google.com |
For published examples of finished landscapes, WIPO lists its patent landscape reports and describes the wider patent analytics programme. Reading two or three of these before you start shows how experts frame the question, the scope and the charts.
Six mistakes in a patent landscape analysis
| Mistake | Why it misleads | Fix |
|---|---|---|
| No stated question | The collection and charts drift | Write the question and decision first |
| Counting documents | Large filers look more active than small ones | Reduce to families and say which method |
| Mixing family methods | Numbers cannot be compared | One method across the project |
| Skipping name cleaning | One applicant is split across spellings | Group names before ranking |
| Ignoring status | Pending applications look like protection | Show granted and pending separately |
| Reading it as legal advice | A landscape does not say what you may sell | Ask a patent attorney for freedom to operate |
Where a landscape fits in the research timeline
A landscape works best early, when you are choosing a direction. When a specific invention comes out of the work, write the invention disclosure and run a focused prior art search before you publish. If the technology came from a partnership, our guide to academic and industry collaborations covers how ownership conversations tend to begin, and the patent and IP strategy category gathers the rest of the series.
Tools and resources
A landscape ends in tables and figures. These free Editverse tools help you prepare them.
Free Research Tools from Editverse
- GraphPro: build publication-ready charts, 25 types, with built-in t-test, ANOVA, correlation, and chi-square p-values. Free, no signup.
- StatPro: free statistical calculators and a test-selector tool covering group comparisons, categorical outcomes, time-to-event analysis, and diagnostic accuracy.
- Flowchart Pro: generate PRISMA 2020, PRISMA-ScR, CONSORT, STROBE, STARD, MOOSE, and ARRIVE flow diagrams directly in your browser.
Professional Services: Patent Landscape Support
If you would rather have the analysis prepared, Editverse builds the search, the family-level screening and the chart set for you. Every package starts with a signed NDA before any technical detail is shared and ends in a format your own patent attorney, agent or TTO can use. Editverse provides technical documentation, search reports and writing support, and patent drafting, filing and prosecution stay with your own registered counsel.
Full file
$3,990
A full technical dossier that includes a landscape summary, a 6-database search with PubMed and Scopus, embodiments and a complete figure set. 3 to 4 weeks. $2,500 if you start from the Disclosure Package.
Search
$350
A ranked prior-art search report across six patent databases plus PubMed and Scopus, mapped to the features of your invention. 3 to 5 business days.
Disclosure
$1,490
A structured invention disclosure with a prior-art summary and figure briefs. 5 to 7 business days, one revision round.
For TTOs
$490
A 60-minute session for technology transfer offices, hospitals and R&D teams. Up to 3 inventions reviewed, with a written roadmap within 48 hours.
Need a landscape for your field?
The patent services page lists every package and how to start.
Conclusion
A patent landscape analysis turns thousands of patent records into a few decisions: where to point the research, who to approach, and which invention to protect first. Write the question, set the scope, count families, report the standard statistics and label every chart so someone else can repeat it.
- Question and decision written
- Country coverage, time window and family method fixed
- Search built for high recall, then screened
- Applicant and inventor names cleaned
- Standard statistics charted with scope in every caption
- Freedom-to-operate questions passed to a patent attorney
Frequently asked questions
What is a patent landscape analysis?
An overview of the patenting activity and trends in a field of technology, built to answer a specific policy or practical question. It reports counts, trends, owners and technology categories rather than a judgement about one invention.
Is a patent landscape the same as a prior art search?
No. A prior art search asks whether one specific invention is new and lists references mapped to its features. A landscape studies a whole field. Landscape results can point to areas for a prior art search, but they do not replace one.
Does a patent landscape analysis show whether I can sell my product?
No. That is a freedom-to-operate opinion. It is country specific, centres on in-force granted patents and their claims, and comes from a patent attorney.
Why count patent families instead of patents?
One invention filed in many countries produces many documents. Counting families stops large filers from looking more active than small ones that filed in fewer places.
How long does a patent landscape analysis take?
It depends on the scope. A narrow topic with a few hundred families can be screened in days, while a broad field with several thousand needs weeks. A written scope at the start is the best way to keep it short.
Related Editverse resources
References
- World Intellectual Property Organization (2015). Guidelines for Preparing Patent Landscape Reports. doi.org/10.34667/tind.28858
- World Intellectual Property Organization. Guidelines for Preparing Patent Landscape Reports (PDF). wipo.int/edocs/pubdocs/en/wipo_pub_946.pdf
- World Intellectual Property Organization. Patent Analytics. wipo.int/en/web/patent-analytics
- World Intellectual Property Organization. Patent Landscape Reports. wipo.int/en/web/patent-analytics/patent-landscapes-reports
- World Intellectual Property Organization. PATENTSCOPE. patentscope.wipo.int
- European Patent Office. Espacenet. epo.org/en/searching-for-patents/technical/espacenet
- United States Patent and Trademark Office. Patent Public Search. uspto.gov/patents/search/patent-public-search