Learn essential techniques for presenting tables, figures, data presentation in professional documents. Master visual content editing for clear and impactful information display in your work

Learn essential techniques for presenting tables, figures, data presentation in professional documents. Master visual content editing for clear and impactful information display in your work

Master the art of bubble chart visualization for your scientific papers. Our authoritative guide provides the expertise you need to leverage this impactful data plotting method.
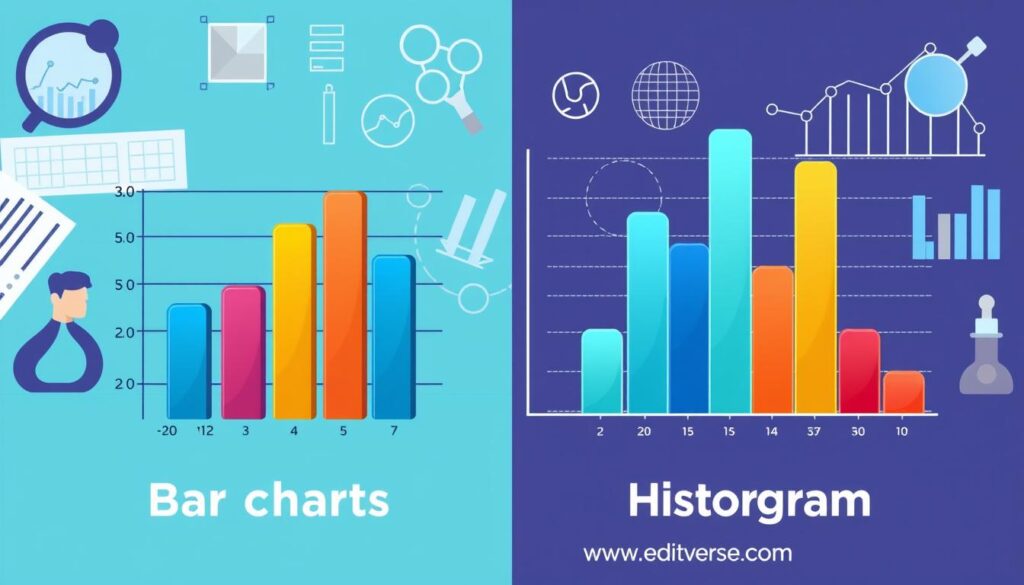
Compare and contrast bar charts and histograms, and uncover the optimal use cases for each in data presentation.
Discover how error bars and confidence intervals enhance graph precision. Learn to effectively use these tools for clearer data visualization and analysis.

Discover how to select the perfect graph type for your research data. Our guide helps researchers effectively communicate findings through optimal data visualization.