
Discover how box plots and whisker diagrams can visually represent data distribution in your research.

Discover how box plots and whisker diagrams can visually represent data distribution in your research.

Discover the right graph type for your research data with our comprehensive guide. Master data visualization and improve your publication success.
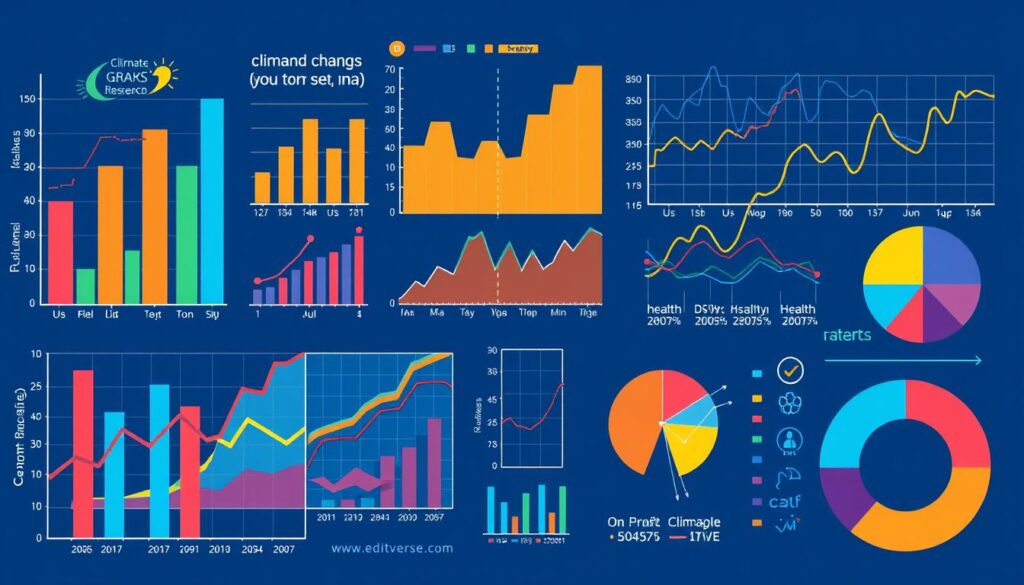
Leverage compound graphs and advanced visualization methods to present your research findings with impact. Unlock success in high-impact journal publication.

Harness the power of heatmaps to visualize complex data sets and uncover valuable insights in your research.

Explore the cutting-edge world of interdisciplinary visualization in scholarly publishing