“All great truths begin as blasphemies.” – George Bernard Shaw
Spatial Autocorrelation [Understanding Geographic Patterns]
Table of Contents
Introduction
In the world of geographic information science, spatial autocorrelation is a key concept that helps us understand how things are arranged on a map. It’s like solving a puzzle where the pieces are locations, and we’re trying to figure out if similar pieces are clustered together or spread apart.
What is Spatial Autocorrelation?
Spatial autocorrelation is a measure of how much objects or activities in one place are similar to objects or activities in nearby places. It’s based on Tobler’s First Law of Geography: “Everything is related to everything else, but near things are more related than distant things.”
In Simple Words
Imagine you’re looking at a map of ice cream shops. If popular ice cream shops tend to be near other popular ice cream shops, that’s positive spatial autocorrelation. If popular shops are spread out far from each other, that’s negative spatial autocorrelation.
Types of Spatial Autocorrelation
- Positive spatial autocorrelation: Similar values cluster together on a map.
- Negative spatial autocorrelation: Dissimilar values appear near each other.
- Zero spatial autocorrelation: Values are randomly distributed.
Why is it Important?
Understanding spatial autocorrelation is crucial because:
- It helps identify patterns and clusters in geographic data.
- It’s essential for accurate statistical analysis of spatial data.
- It aids in predicting values at unsampled locations.
- It’s useful in various fields like epidemiology, criminology, and urban planning.
How is it Measured?
There are several ways to measure spatial autocorrelation:
- Global Moran’s I: This is the most common measure. It ranges from -1 (perfect dispersion) to +1 (perfect correlation), with 0 indicating random distribution.
- Local Moran’s I: This identifies local clusters and spatial outliers.
- Geary’s C: Similar to Moran’s I, but more sensitive to local differences.
- Getis-Ord G: Measures the concentration of high or low values.
Focus on Global Moran’s I
The Global Moran’s I is calculated as follows:
I = (N / W) * (Σi Σj wij (xi - x̄)(xj - x̄)) / (Σi (xi - x̄)²)

Where:
N = number of spatial units
W = sum of all spatial weights
wij = spatial weight between i and j
xi, xj = attribute values for i and j
x̄ = mean of the attribute
Interpretation:
- I > 0: Positive spatial autocorrelation
- I < 0: Negative spatial autocorrelation
- I ≈ 0: Random spatial pattern
Real-World Examples
1. Urban Heat Islands
Cities often exhibit higher temperatures in densely built areas compared to surrounding rural areas. This is a classic example of positive spatial autocorrelation.
2. Disease Spread
The spread of infectious diseases often shows spatial patterns related to population density and movement, demonstrating how spatial autocorrelation can be crucial in epidemiology.
3. Property Values
Housing prices tend to be similar in neighboring areas due to shared amenities and socioeconomic factors, another instance of positive spatial autocorrelation.
4. Crime Hotspots
Crime rates often cluster in certain areas of a city, showing positive spatial autocorrelation. This information is valuable for law enforcement strategies.
5. Biodiversity Distribution
Species distribution in ecosystems often shows spatial autocorrelation due to environmental factors like climate and terrain.
Recent Advancements (2024-2025)
- Machine Learning Integration: Combining spatial autocorrelation with machine learning algorithms for improved prediction models.
- Big Data Analytics: Applying spatial autocorrelation techniques to large-scale datasets for urban planning and smart city initiatives.
- 3D Spatial Autocorrelation: Extending traditional 2D analysis to 3D space, useful for analyzing multi-story buildings or atmospheric data.
- Temporal-Spatial Autocorrelation: Developing new measures that incorporate both spatial and temporal dimensions for dynamic phenomena.
Challenges and Future Directions
- Scale Dependency: Addressing how spatial autocorrelation changes across different geographic scales.
- Non-Stationarity: Developing methods to handle spatial processes that vary across a study area.
- Computational Efficiency: Improving algorithms to handle increasingly large and complex spatial datasets.
- Integration with Real-Time Systems: Incorporating spatial autocorrelation analysis into dynamic, real-time decision-making platforms.
Conclusion
Spatial autocorrelation remains a fundamental concept in geographic information science. As we move through 2024-2025, its applications continue to expand, offering valuable insights across various fields. By understanding how things are related in space, we can make better decisions, create more accurate models, and gain deeper insights into the world around us.
Few Examples along with Key concepts [Again]
Spatial autocorrelation is a key concept in geographic analysis that measures the degree to which a set of spatial features and their associated data values tend to be clustered together in space (positive spatial autocorrelation) or dispersed (negative spatial autocorrelation).
Key Concepts:
- Positive Spatial Autocorrelation: Similar values cluster together in space
- Negative Spatial Autocorrelation: Dissimilar values appear near each other
- No Spatial Autocorrelation: Values are randomly distributed
Measures of Spatial Autocorrelation:
- Moran’s I
- Geary’s C
- Getis-Ord G
Published Examples:
1. Long-term changes in spatial range of geomagnetic field
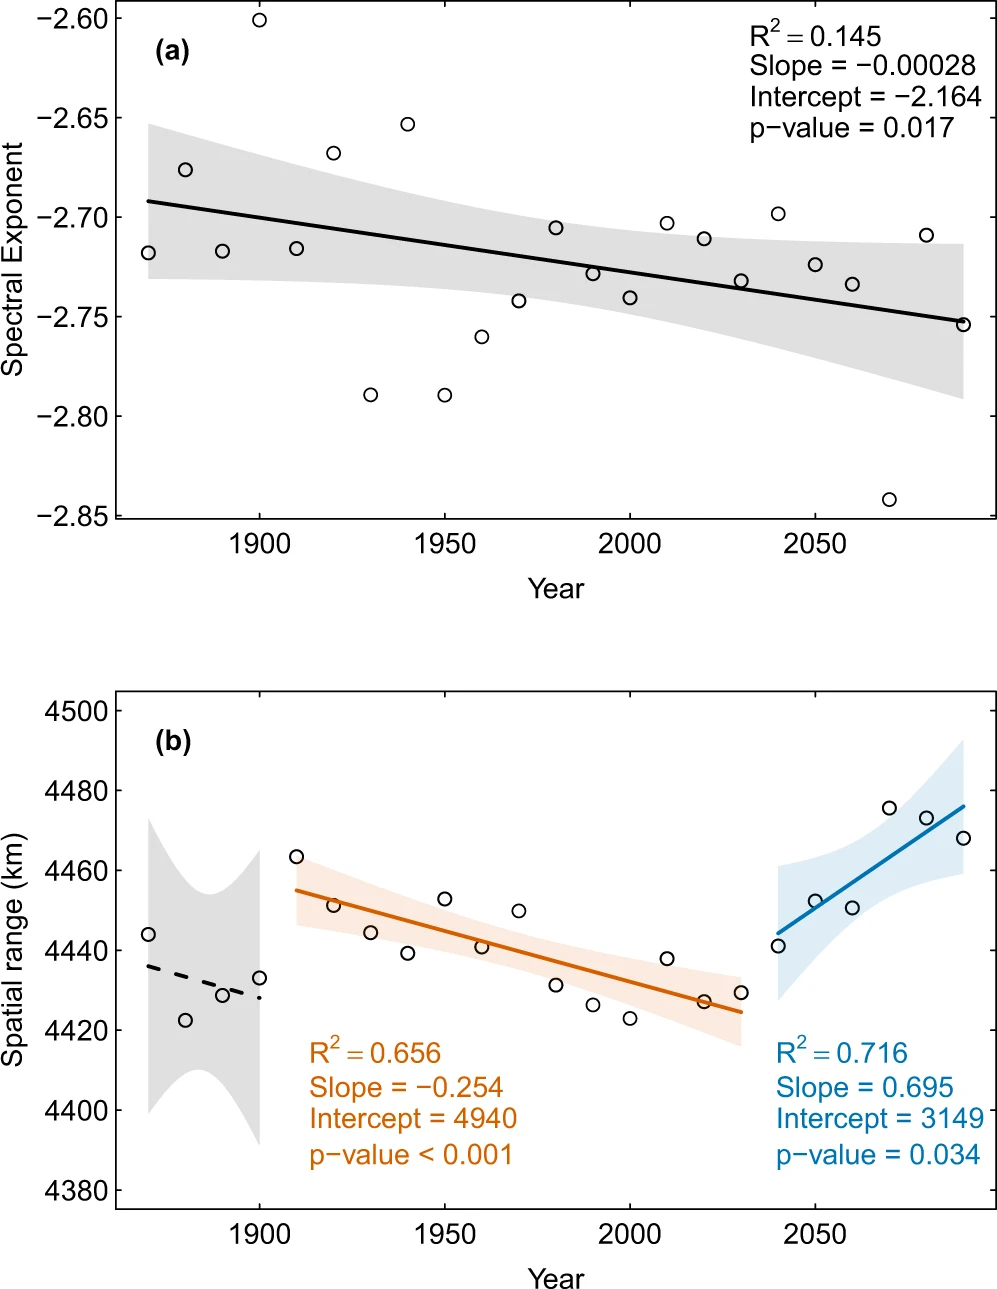
Source: Kloss, C., Finlay, C.C. Time-dependent low-latitude core flow and geomagnetic field acceleration pulses. Sci Rep 8, 17137 (2018).
This study examines changes in the spatial range of the geomagnetic field over time. The graph shows:
- A decreasing trend in spatial range from 1900 to 2000 (R² = 0.656, p-value < 0.001)
- An increasing trend from 2000 to 2050 (R² = 0.716, p-value = 0.034)
This example demonstrates how spatial autocorrelation can change over time, indicating shifts in the underlying geophysical processes.
2. Winter Near-Surface Temperature Trends in North America
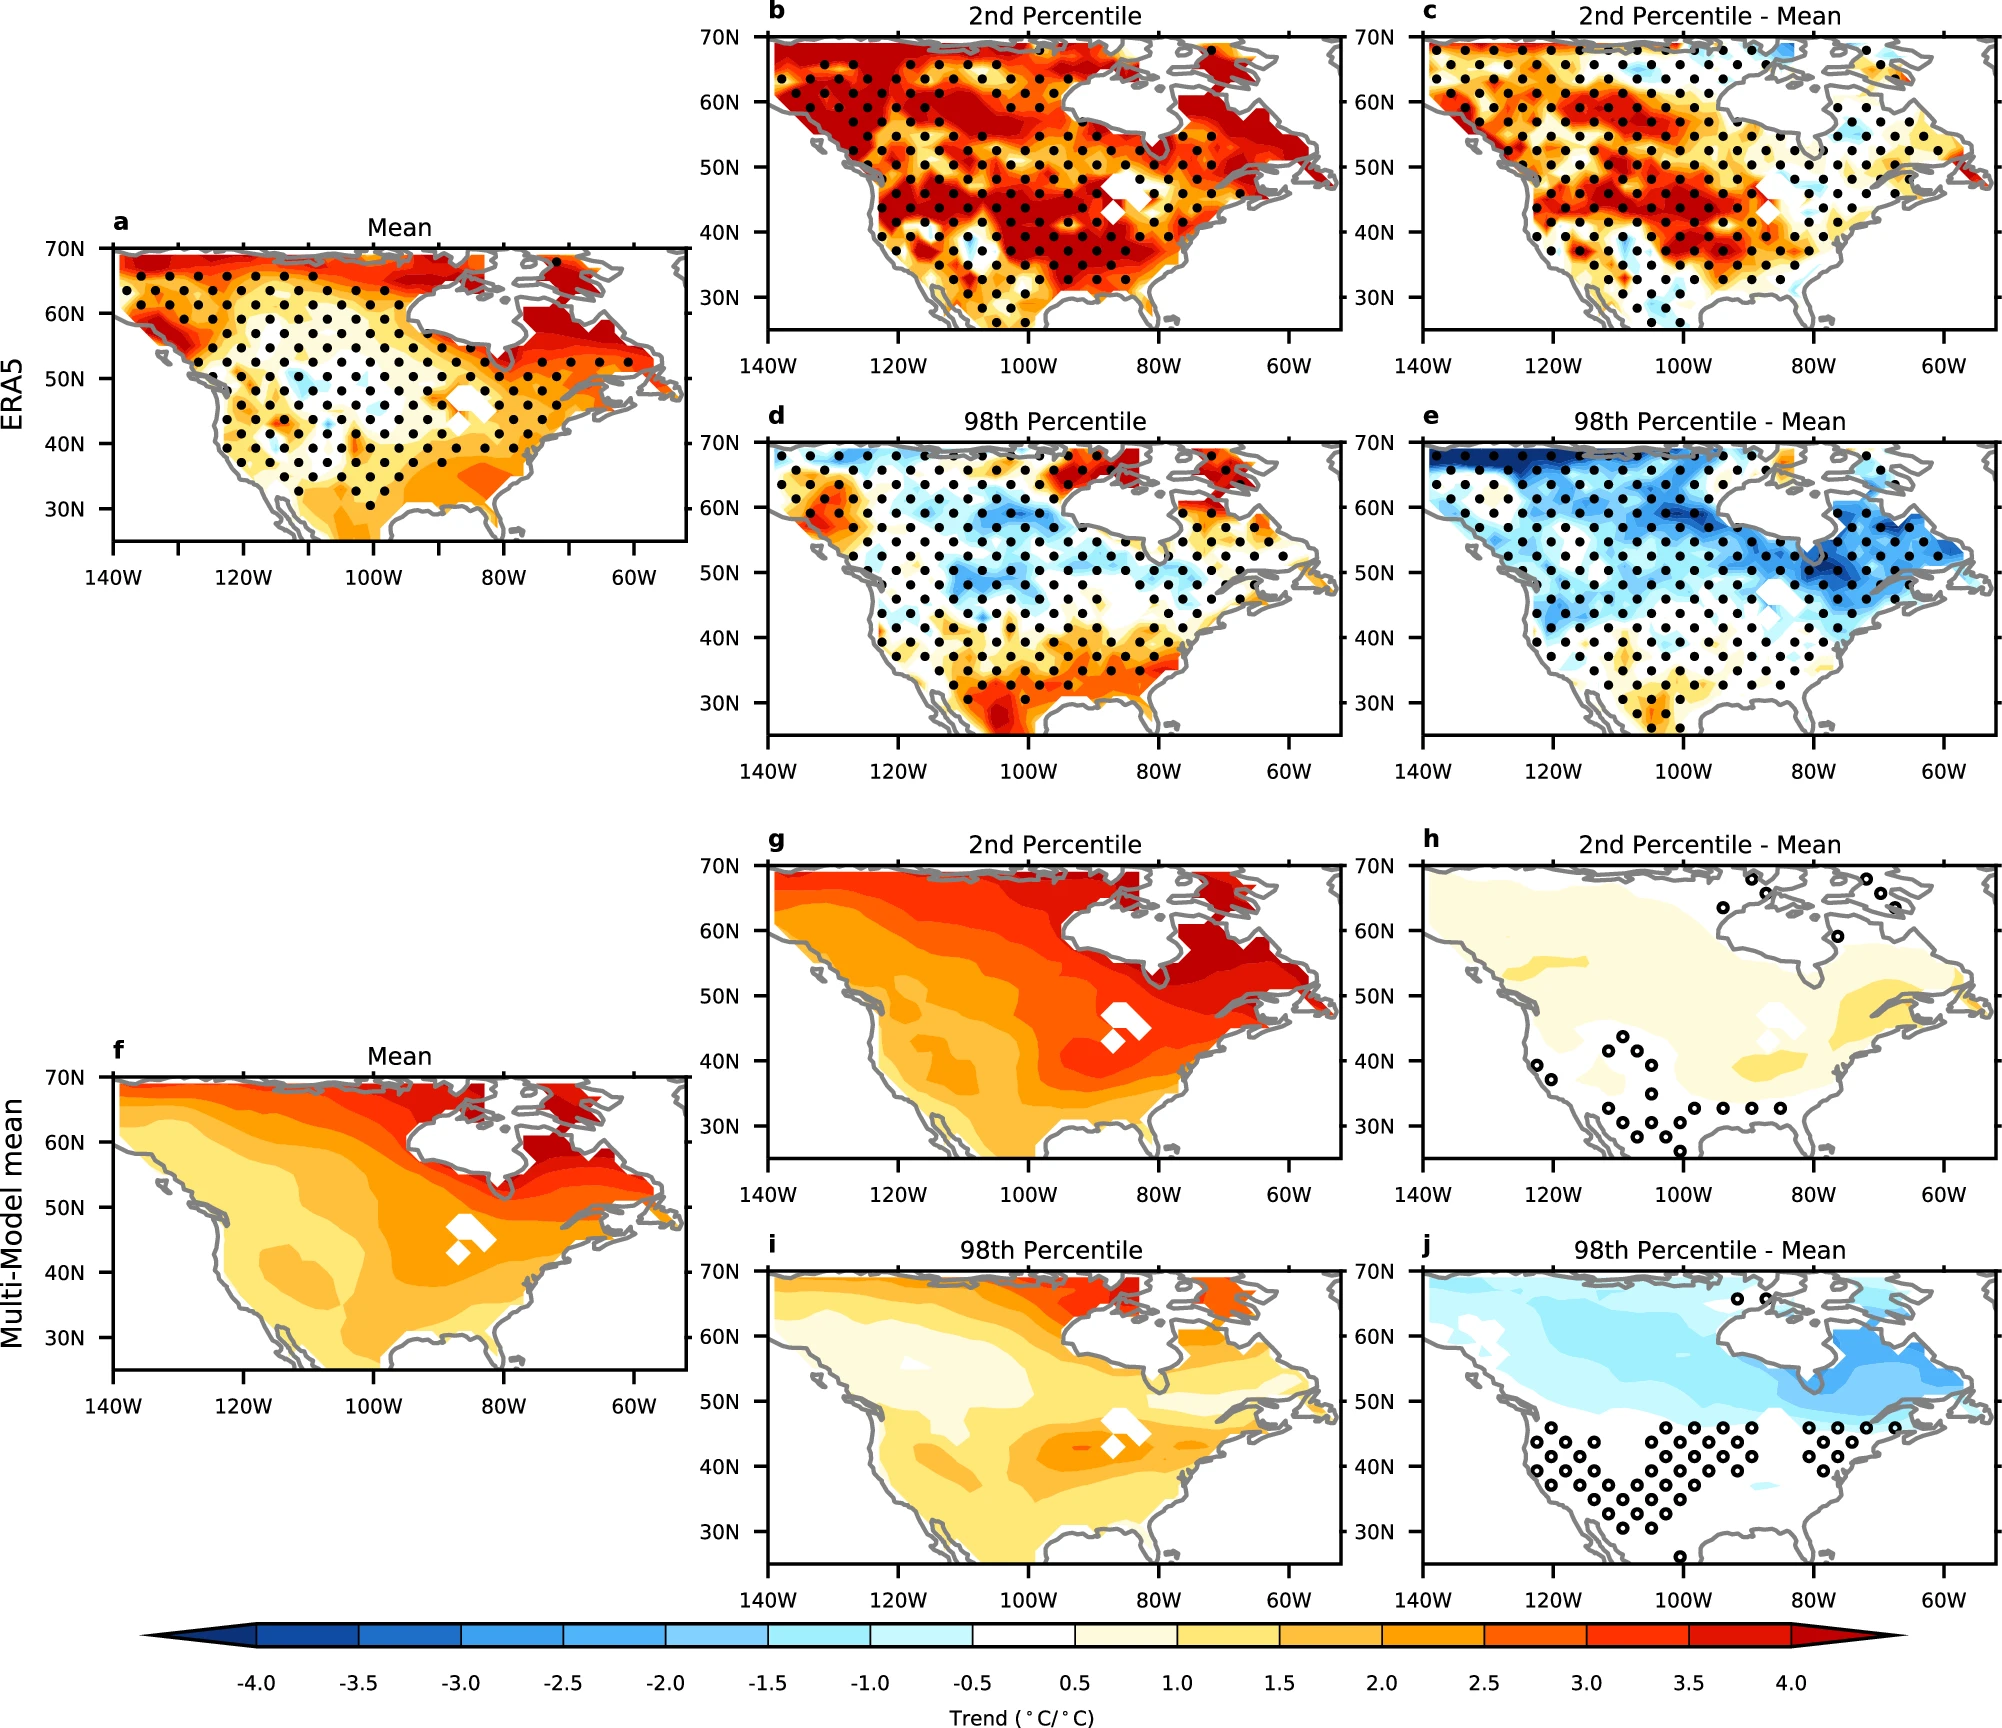
Source: Dai, A., Luo, D. & Song, M. Arctic warming hotspot in winter is shifting from North America to Eurasia. Nat Commun 15, 4256 (2024).
This study analyzes winter near-surface temperature trends in North America from 1980 to 2022. The figure shows:
- Spatial patterns of temperature trends for mean, 2nd percentile, and 98th percentile temperatures
- Comparison between ERA5 reanalysis data (top row) and multi-model mean (bottom row)
- Clear spatial autocorrelation in temperature trends, with distinct patterns across different regions
- Stronger warming trends in northern regions, especially in the 2nd percentile (coldest temperatures)
- Differences between percentiles and mean trends, highlighting non-uniform changes in temperature distributions
This example illustrates complex spatial patterns in climate data, demonstrating how spatial autocorrelation can vary across different statistical measures and geographic regions.
3. Urban Heat Islands
Urban areas often exhibit higher temperatures compared to surrounding rural areas, a phenomenon known as the Urban Heat Island (UHI) effect. This is a classic example of positive spatial autocorrelation in temperature data.
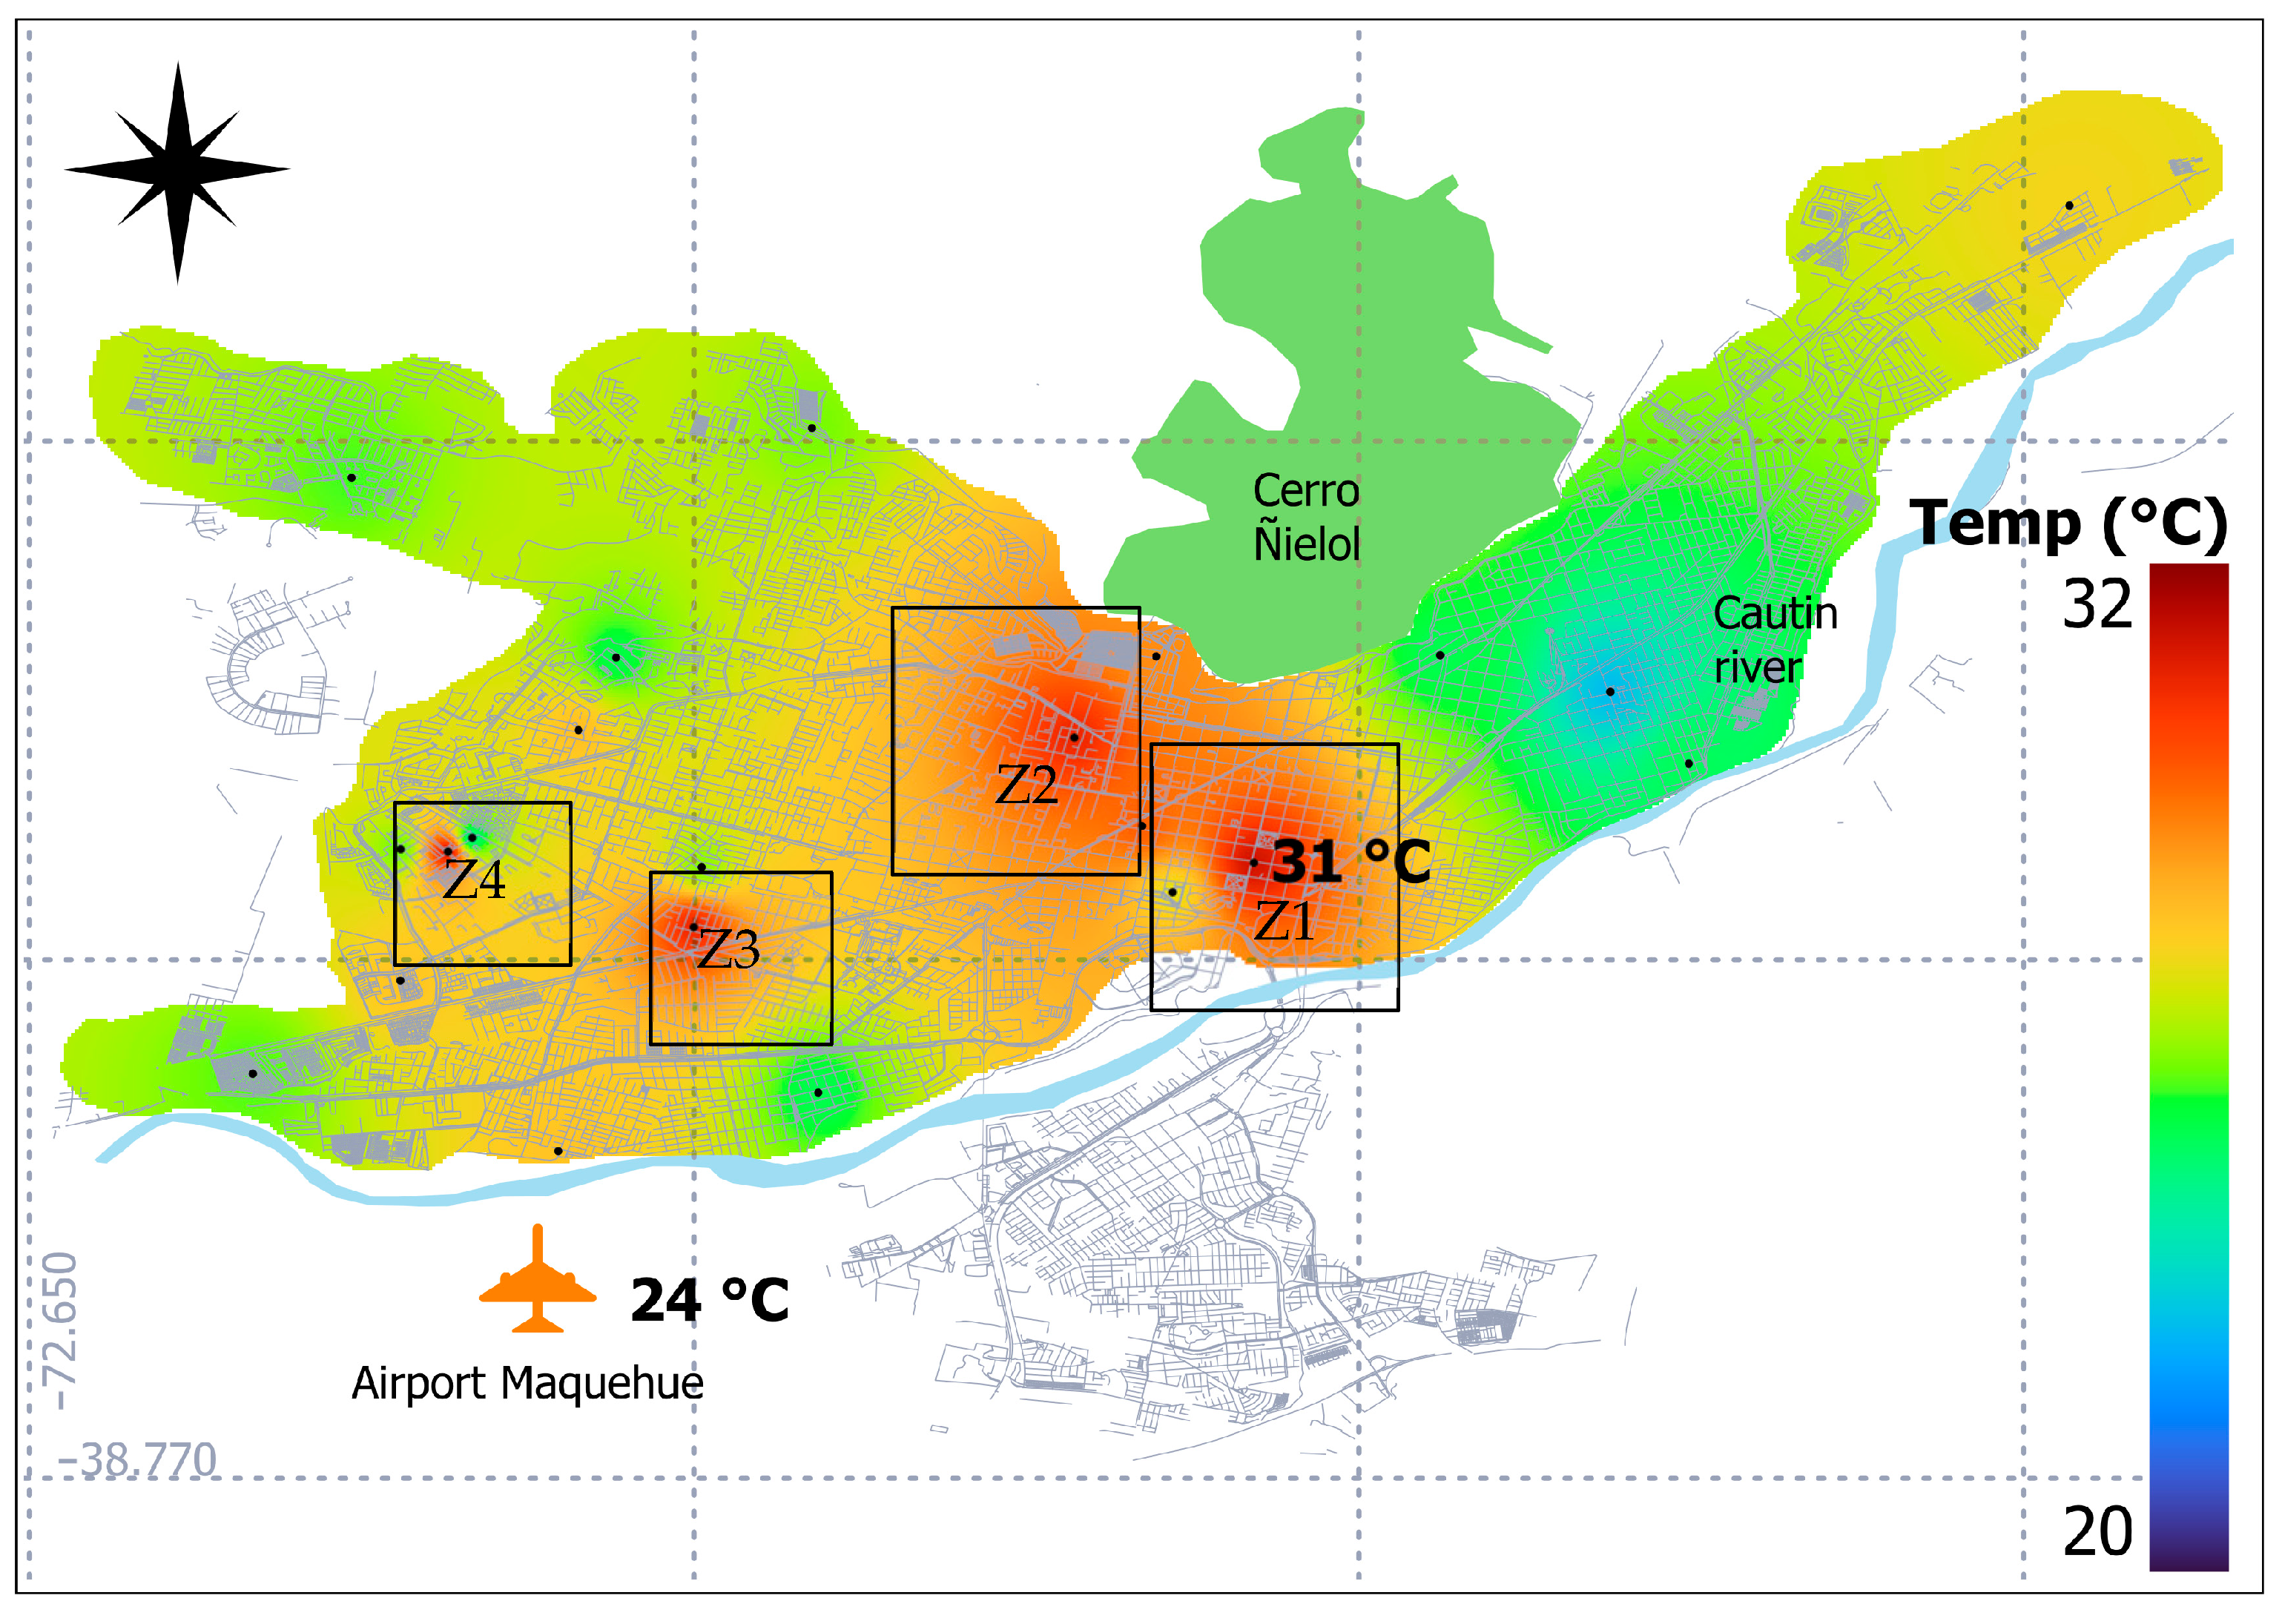
Source: Villalobos-Soublett, E.; Hernández-Moreno, A.; Molina-Martínez, J.M.; Ruiz-Canales, A.; Escarabajal-Henarejos, D. Spatial Distribution of Land Surface Temperature in Temuco City, Chile. Eng. Proc. 2023, 39, 80.
This image illustrates the Urban Heat Island effect in Temuco, Chile:
- Clear temperature gradient from city center (warmer) to outskirts (cooler)
- Highest temperatures (up to 31°C) observed in densely built-up areas (Z1, Z2, Z3, Z4)
- Cooler temperatures near natural features like Cerro Ñielol and the Cautín river
- Airport Maquehue, outside the main urban area, shows a lower temperature (24°C)
- Temperature range from 20°C (blue) to 32°C (red), demonstrating significant spatial variation
This example clearly shows positive spatial autocorrelation in urban temperatures, with hot spots clustered in the city center and cooler areas on the periphery and near natural features.
Additional study: Rizwan, A.M., Dennis, L.Y.C. & Liu, C. A review on the generation, determination and mitigation of Urban Heat Island. J Environ Sci 20, 120–128 (2008).
4. Disease Clustering
Epidemiologists use spatial autocorrelation to identify disease clusters, which can help in understanding transmission patterns and implementing targeted interventions.

Source: Guo, Y., Cheng, C., Zeng, Y. et al. Analysis on the characteristics of spatio-temporal evolution and aggregation trend of early COVID-19 in mainland China. Sci Rep 12, 4507 (2022).
This figure illustrates the spatio-temporal evolution of early COVID-19 cases in mainland China:
- Two maps showing the cumulative confirmed COVID-19 cases on January 23 and February 11, 2020
- Clear spatial clustering of cases, particularly in central and eastern China
- Rapid increase in case numbers and spatial spread over the 19-day period
- Highest concentration of cases (red areas) expanding from one region to multiple regions
- Western regions of China showing lower case numbers throughout the period
This example demonstrates strong positive spatial autocorrelation in disease spread, with clear hotspots and a pattern of geographic diffusion over time. It highlights the importance of spatial analysis in understanding and responding to disease outbreaks.
Additional study: Lai, P.C., So, F.M. & Chan, K.W. Spatial Epidemiological Approaches in Disease Mapping and Analysis. CRC Press (2008).
5. Property Values
Real estate prices often show positive spatial autocorrelation, with similar property values clustering in neighborhoods.
Study example: Basu, S. & Thibodeau, T.G. Analysis of Spatial Autocorrelation in House Prices. The Journal of Real Estate Finance and Economics 17, 61–85 (1998).
5. Property Values
Real estate prices often show positive spatial autocorrelation, with similar property values clustering in neighborhoods.

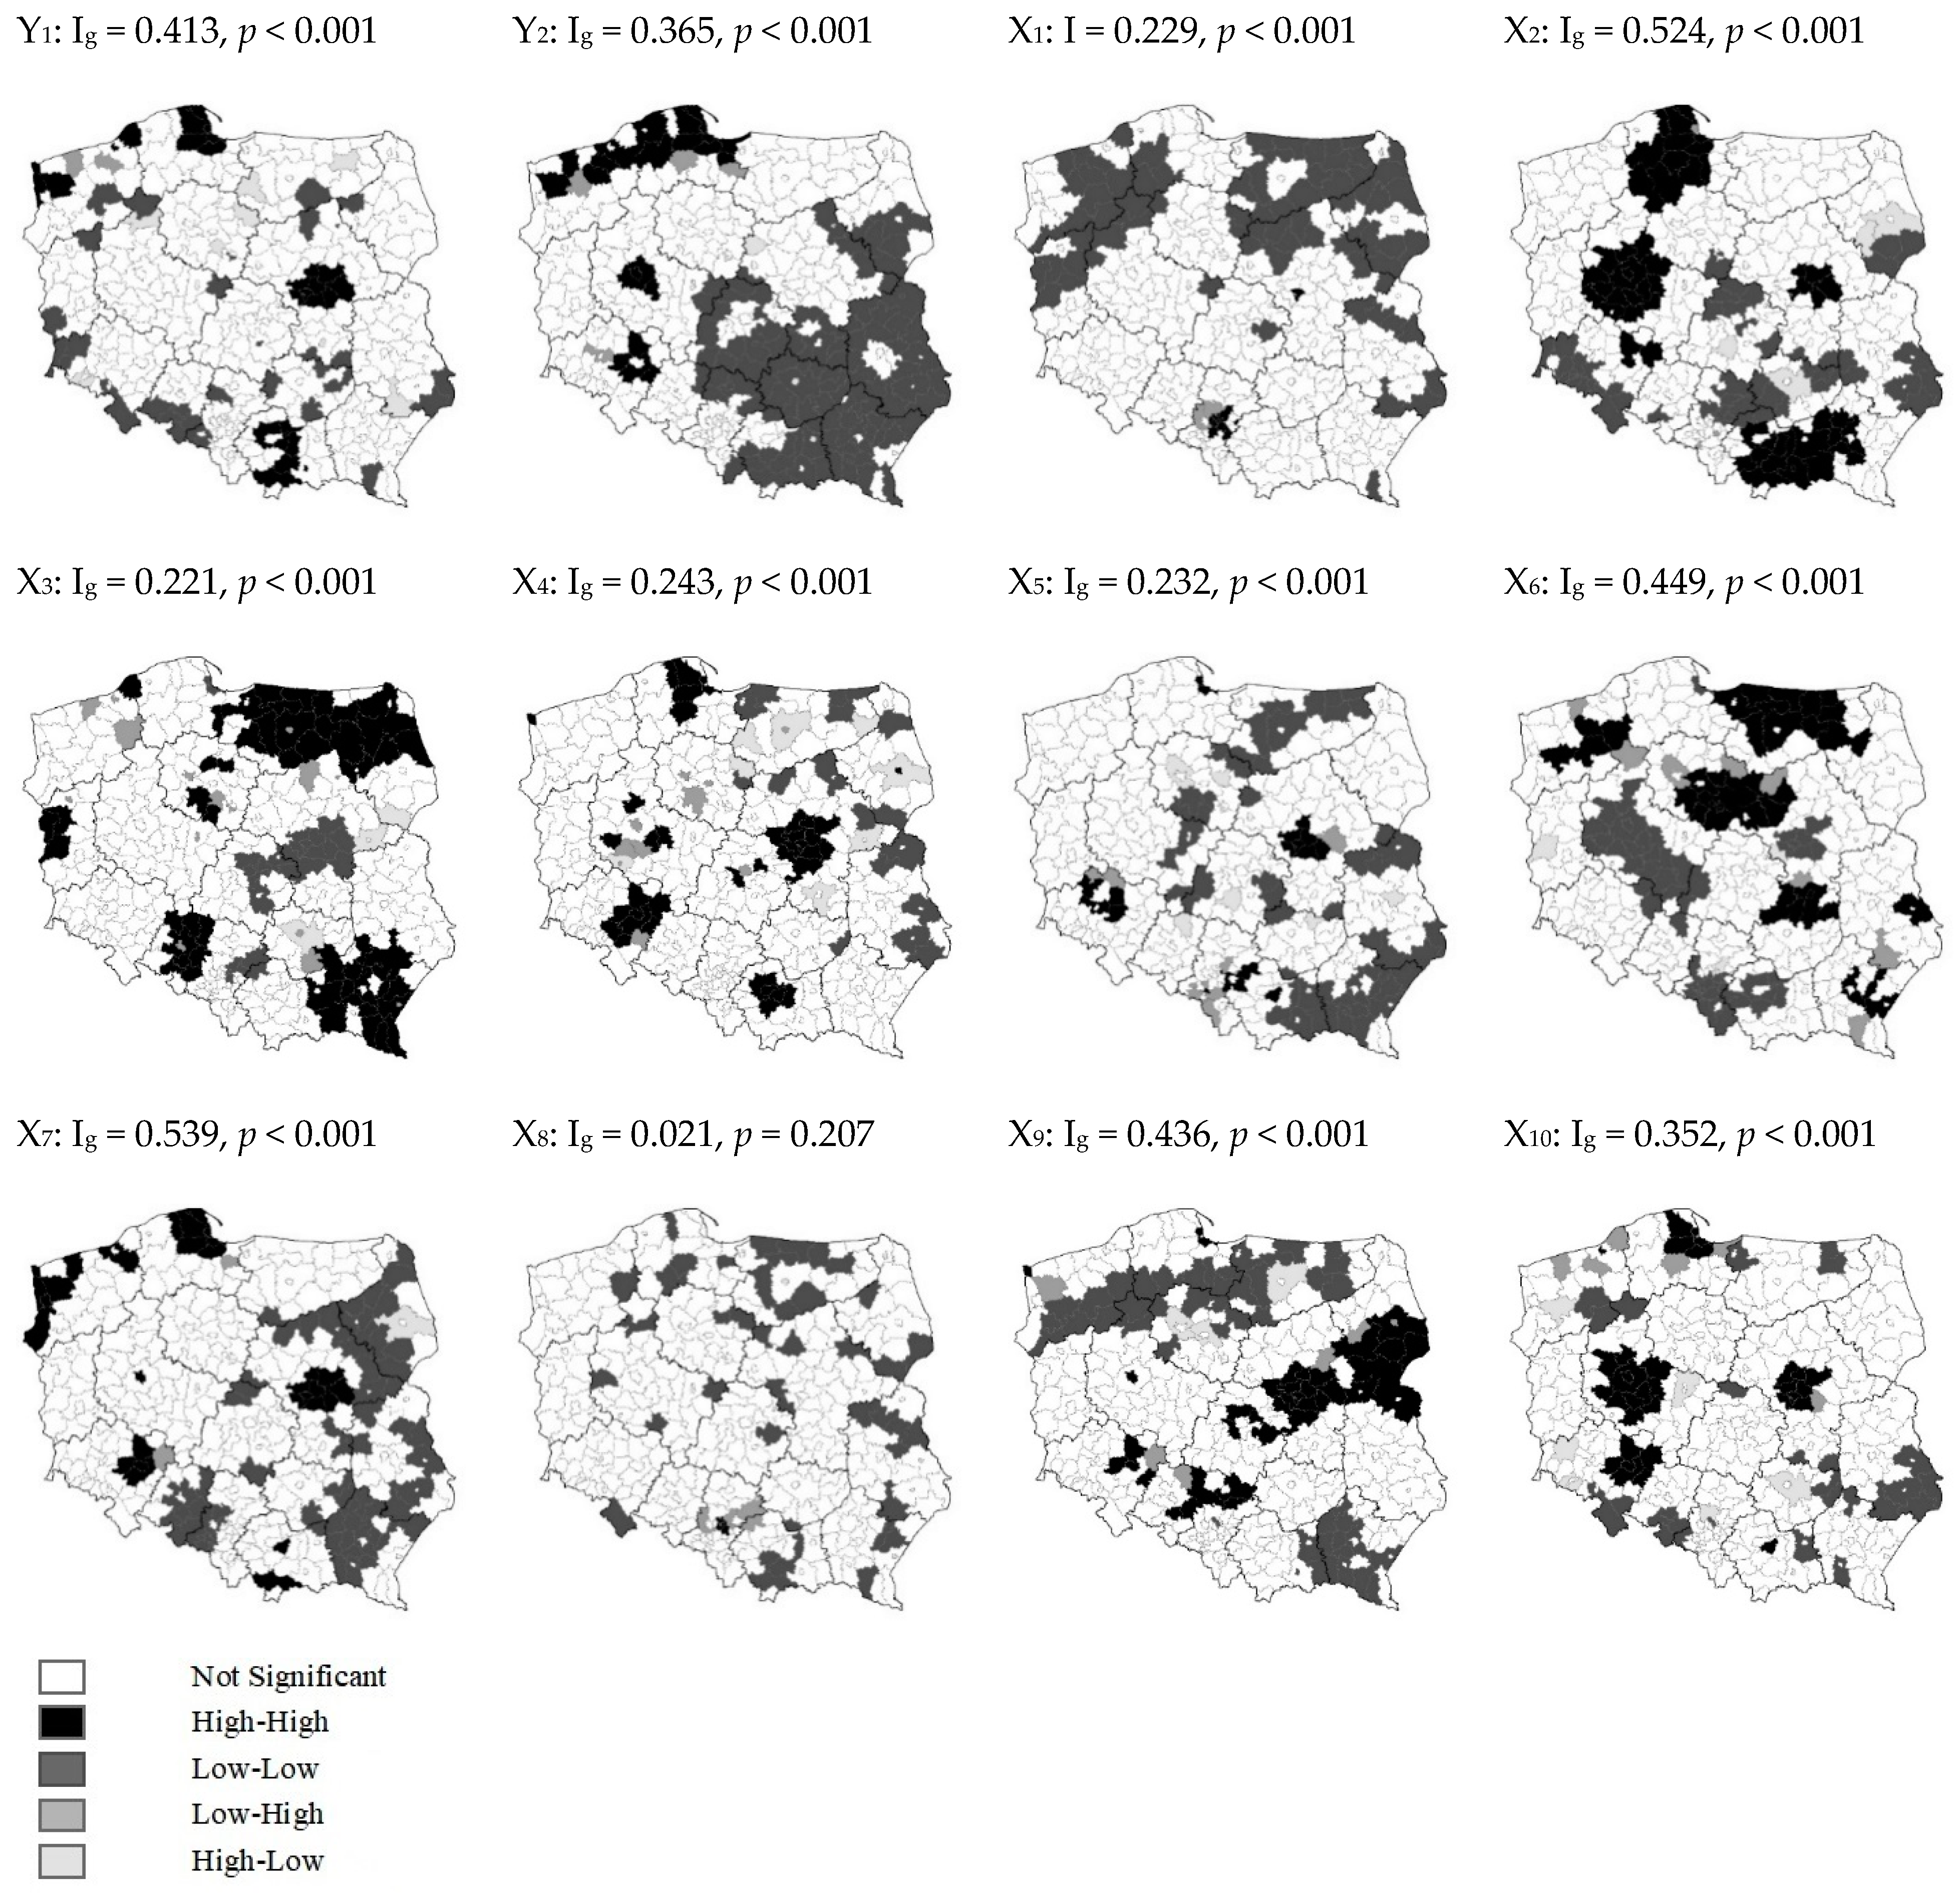
Figure 2. Local and global statistics of Moran’s I. Source: own research based on GUS data.
Source: IJGI 09 00380 g002
This figure illustrates the spatial autocorrelation of property values across different regions in Poland:
- The maps show various socio-economic indicators (Y1, Y2, X1-X10) and their spatial patterns
- Each map is accompanied by a global Moran’s I statistic (Ig) and its p-value
- Most indicators show statistically significant positive spatial autocorrelation (Ig > 0, p < 0.001)
- The legend indicates different types of spatial clusters:
- High-High: Areas with high values surrounded by high values
- Low-Low: Areas with low values surrounded by low values
- Low-High: Areas with low values surrounded by high values
- High-Low: Areas with high values surrounded by low values
- Notable patterns include:
- Y1 and Y2 show distinct regional clusters, particularly in the south and west
- X2 displays the strongest positive spatial autocorrelation (Ig = 0.524)
- X8 is the only indicator without significant spatial autocorrelation (Ig = 0.021, p = 0.207)
This example demonstrates how property values and related socio-economic factors exhibit strong spatial dependencies. The clustering of high and low values in specific regions suggests that location plays a crucial role in determining property values and associated economic indicators.
Additional study: Basu, S. & Thibodeau, T.G. Analysis of Spatial Autocorrelation in House Prices. The Journal of Real Estate Finance and Economics 17, 61–85 (1998).
This article will cover the many sides of spatial autocorrelation. We’ll talk about its big role in Geographic Information Systems (GIS), its stats importance, and its part in seeing patterns in cities. By getting into these topics, you’ll find out important info that can help with planning and managing resources.
To help you learn more, check out graduate programs like those at Florida State University’s Department of Geography. These programs offer deep learning in these key areas through courses and research chances. Learn more about these programs at this link1.
Key Takeaways
- Spatial autocorrelation is key to understanding geographic relationships.
- It boosts urban planning and environmental modeling.
- Geographic Information Systems are crucial for analyzing spatial data.
- Statistical methods measure spatial connections well.
- Urban growth patterns can be spotted through spatial clustering analysis.
- Future advances in spatial analysis will shape various fields.
Introduction to Spatial Autocorrelation
Spatial autocorrelation looks at how a variable relates to itself across space. It’s key for Spatial Analysis because it shows how geographical data is connected. By spotting these connections, experts can find patterns that aren’t seen with regular analysis.
At Old Dominion University, the Geography program has 56 courses for the 2024-2025 year, each worth 3 credits2. Students learn about “Hazards: Natural and Technological” and geography in different parts of the world2. This wide range of courses helps students use spatial autocorrelation in their studies.
Courses like GEOG 335 Geographic Information Systems I and GEOG 336 Geospatial Field Methods teach how to apply spatial analysis in real life3. These classes show the importance of understanding spatial connections. They also help in making better decisions in various fields, using data to guide them.
The Introduction to Spatial Autocorrelation opens the door to seeing how spatial relationships affect geography research. As you learn more about spatial analysis, you’ll get better at using geographic data. This will change how you see and use geographic information.
The Role of Geographic Information Systems (GIS)
Geographic Information Systems (GIS) are key tools for today’s spatial analysis. They help you see and understand geographical data better. With GIS, you can see how places are connected, which is key in studying how areas are linked.
Through advanced visuals, GIS makes complex data easy to grasp. It shows how people and places change over time. This is super useful for understanding things like population shifts and environmental changes.
Courses like GGIS 371 – Spatial Analysis and GGIS 380 – Geographic Information Systems II teach you the basics of spatial analysis. They cover both the natural and human sides of geography. You’ll learn how GIS solves problems in different formats4.
These courses also mix theory with real-life examples. You’ll study how businesses pick locations and how cities can be more sustainable. This mix of theory and practice is really helpful.
As more jobs in geospatial data science open up, knowing GIS is more important than ever. Graduates are ready for jobs like Remote Sensing & GIS Software Analysts or GIS Technical Program Managers5. The program has 1,300 hours of learning, with both required and optional courses. This prepares you well for geospatial analysis.
By taking these courses, you’ll learn about important spatial patterns. This knowledge helps you make better decisions for communities and the environment. GIS is key in solving big challenges like urban growth and social and environmental issues.
Understanding Geospatial Analysis
Geospatial Analysis is key for studying geographical patterns and how data points relate to each other. It uses stats to look at spatial relationships and geographic events. Courses like GISC 20061 Ancient Landscapes I teach theory and methods in landscape studies. They use Geographic Information Systems (GIS) to analyze data types like archaeological and environmental data6.
For a deep understanding of Geospatial Analysis, certain core courses are vital. For example, GISC 20500 Introduction to Spatial Data Science covers important topics like spatial autocorrelation and cluster detection6. Course 6328 goes deeper, focusing on spatial analysis and modeling. It stresses the importance of inferential statistics and checking spatial accuracy7.
Dealing with issues like the modifiable areal unit problem is crucial in Geospatial Analysis. To correctly understand spatial data, you need to use various methods. These include exploratory data analysis, univariate descriptive statistics, and spatial regression models. This shows how Geospatial Analysis uses different methods to uncover trends and relationships.
Learning these basics isn’t just about theory. Practical skills like spatial regression analysis, which deals with statistical methods for spatial dependence, are key. Tools like R and Python make these methods easier to apply6. This knowledge helps you see the importance of spatial relationships.
Spatial Statistics and Their Importance
Spatial statistics are key for digging into and making sense of spatial data. They help you spot patterns and connections that might not be clear at first glance. Knowing these methods well is crucial for grasping the Importance of Spatial Analysis in fields like urban planning and environmental studies.
Tools like point patterns and spatial dispersion let you deeply study how data points spread out over a region. For example, the 2024-2025 academic catalog lists specific requirements, like finishing General Education courses and getting instructors’ okay, which boosts your knowledge in this area2.
- Point pattern analysis helps figure out if events are grouped together, spread out, or random.
- Correlation coefficients show how closely two variables are linked.
- Knowing about spatial autocorrelation helps spot local changes in your data.
Courses on quantitative methods with practical exercises deepen your hands-on skills and grasp of spatial statistics8. For instance, advanced spatial analysis courses need you to have done certain courses and gotten good grades2.
Learning these statistical tools through structured classes is key for making smart choices, especially in fields like public health. Spatial analysis can shape how resources are used. With focused study, you can work with complex data better, helping solve big environmental problems.
Concepts of Spatial Clustering
Spatial clustering is key in geospatial analysis. It groups data points that are closer together than expected. Clustering techniques like K-means and hierarchical clustering help spot these clusters. These methods help researchers see patterns in data, giving deep insights into geographic phenomena.
It’s crucial for studying cities and the environment. For example, it shows patterns that affect how we use resources, plan cities, and protect the environment. These insights help make better decisions for community growth and protecting nature.
Certain courses teach these important ideas. GEOG 3125 Weather and Climate and GIS 120 Web GIS are great examples. They give students the theory and skills needed for spatial clustering. GEOG 3255 Introduction to Remote Sensing and GIS 226 Spatial Analysis With GIS also teach how to apply these techniques to complex data910.
Here’s a table with courses that help understand spatial clustering and its techniques:
| Course Code | Course Title | Credits |
|---|---|---|
| GEOG 3125 | Weather and Climate | 3 |
| GEOG 3255 | Introduction to Remote Sensing | 3 |
| GIS 120 | Web GIS | 3 |
| GIS 226 | Spatial Analysis With GIS | 3 |
| GEOG 3400 | Economic Geography | 3 |
| GIS 240 | Python Scripting for GIS | 3 |
Moran’s I: Measuring Spatial Autocorrelation
Moran’s I is a key tool for finding patterns in geographic data. It shows how values near each other are related. This helps us understand geographic patterns better.
This method looks at the mean of the data and how each point differs from it. It gives a clear picture of how data changes across different areas.
Understanding Moran’s I is easy. A score near zero means no pattern. A positive score means similar values are together. A negative score means unlike values are close.
This method uses different techniques to show how areas are connected. For example, geographically weighted regression (GWR) helps analyze local changes. This makes your analysis stronger and helps in making better decisions11.
In summary, Moran’s I helps us deeply understand how geographic data is connected. As data gets more complex, tools like Moran’s I are key for analyzing patterns and trends in many areas.
| Aspect | Description |
|---|---|
| Purpose | Measuring spatial autocorrelation in geographical datasets |
| Calculation | Mean of values and weighted sum of deviations from the mean |
| Interpretation Values | Close to 0: no autocorrelation; Positive: clustering of similar values; Negative: clustering of dissimilar values |
| Applications | Urban planning, resource allocation, spatial variability analysis |
| Related Methodologies | Geographically weighted regression (GWR), spatial weighted matrices |
Hotspot Analysis in Urban Environments
Hotspot analysis is key in finding areas with high crime or health issues in cities. It uses tools and methods to spot patterns that are hard to see. This helps us understand where problems cluster, which is vital for making smart decisions.
Urban planners use it to find crime hotspots, so they can act and use resources better. For health issues, it shows where problems are worst, helping authorities improve health in those areas. Studies show how this method helps cities tackle their unique challenges effectively.
The following table summarizes key aspects of courses that address topics pertinent to hotspot analysis and urban environments:
| Course Name | Credits |
|---|---|
| Environmental Geography (GEO 101) | 4 |
| Urbanization (GEO 103) | 4 |
| Urban Geography – Experiential Learning (GEO 133) | 4 |
| Sustainable Urban Development (GEO 200) | 4 |
| Race, Justice, and the Urban Environment (GEO 205) | 4 |
| Human-Animal Urban Community Trauma (GEO 221) | 4 |
These courses and internships give students hands-on experience with real-world urban issues. They prepare students for hotspot analysis by teaching them the skills they need.
Looking into environmental and urban studies will deepen your grasp of urban complexities. The new CEGU program shows how we need to combine different fields to solve urban challenges.
“Hotspot analysis serves as a crucial tool for urban planners, allowing for targeted interventions in communities facing various challenges.”
By using technology and research, hotspot analysis can greatly improve city planning and safety12.
Applications in Environmental Modeling
Environmental modeling uses spatial autocorrelation to tackle many environmental problems. It predicts patterns of natural resources, biodiversity, and climate change impacts. This gives us key insights into how ecosystems work.
The course GEOG 3120 Environmental/GIS Modeling teaches important ideas and skills in environmental modeling with GIS technology. It covers three main areas: spatial, attribute, and combined modeling. These methods help students solve problems like crime patterns and where species live, aiding conservation efforts15.
Environmental modeling also uses advanced stats to analyze spatial data. Methods like multiple correlation and regression show how environmental factors link together16. This helps us understand complex ecological relationships better. It also helps in making informed decisions about managing resources.
Real-world projects in courses like GEOG 3190 show how this field applies in practice. Students work with lidar technology on projects that help with managing natural resources. This tech measures elevation and three-dimensional structures, aiding in land use and environmental planning.
| Application Area | Modeling Technique | Example Course |
|---|---|---|
| Natural Resource Management | Spatial Domain Modeling | GEOG 3120 |
| Species Distribution | Attribute Domain Modeling | GEOG 3120 |
| Crime Analysis | Combined Modeling | GEOG 3120 |
| Mapping Elevation | Lidar Data Analysis | GEOG 3190 |
These advanced uses in environmental modeling show how spatial autocorrelation is key. It helps predict and manage the complex interactions between environmental factors.
Spatial Autocorrelation: Analyzing Geographic Patterns in 2024-2025
In the next few years, studying geographic patterns will be key to understanding many things across different areas. Courses like GEOG 3023 teach students about statistical and geographic data. They cover important tools for analyzing places and solve real-world problems through labs17.
GEOG 3023 also shows how to work with data and use advanced software for Earth and social science issues. Other courses, like GEOG 3113 and GEOG 3153, focus on managing water resources and being good stewards of the environment18.
Looking ahead, we’ll see big changes in how we use machine learning for predicting and visualizing data. This will affect fields like urban planning and environmental management. People in these areas will need to quickly learn about these new tools.
Studying geographic patterns will also help us deal with climate change. Courses will cover long-term changes in the Earth’s atmosphere and how weather affects the economy. This knowledge will help experts handle big global challenges better18.
Implications for Urban Planning
Understanding the Implications of Spatial Autocorrelation is key for good Urban Planning. It helps in making smart decisions about building, zoning, and using resources. For example, planners use spatial analysis to pick the best spots for new buildings. This way, they make sure the area gets better for people and the economy. The course Doing Good by Doing Well shows how Boston’s city planning can be improved with smart real estate choices19.
Real Estate Development Studios show how different fields work together to make places better. Teams aim to increase value in many ways, making professional plans for specific sites20. In China, architects and urban designers work together on projects, showing the importance of custom plans for different places20.
The Digital City Design Workshop combines urban design with technology for better cities. This approach leads to cities that are good for people and the economy. Courses like Data Science and Real Estate teach students about data science’s role in planning. This prepares them for the changing world of Urban Planning20.
| Course Title | Credits | Term | Instructor(s) |
|---|---|---|---|
| GEOG 201 Introductory Geo-Information Science | 3 | Fall 2024 | Elrick, Tim |
| GEOG 217 Cities in the Modern World | 3 | Winter 2025 | Forest, Benjamin; Moser, Sarah |
| GEOG 351 Quantitative Methods | 3 | Winter 2025 | Breau, Sébastien |
| GEOG 381 Geographic Thought and Practice | 3 | Winter 2025 | Turner, Sarah |
| GEOG 491D1 Honours Research | 3 | Fall 2024 | Turner, Sarah |
| GEOG 491D2 Honours Research | 3 | Winter 2025 | Turner, Sarah |
| GEOG 202 Statistics and Spatial Analysis | 3 | Fall 2024 | Mahmud, Mallik |
| MATH 203 Principles of Statistics 1 | 3 | Fall/Winter 2024-2025 | Stephens, David; Correa, Jose Andres (Fall); Sajjad, Alia (Winter) |
| PSYC 204 Introduction to Psychological Statistics | 3 | Fall/Winter 2024-2025 | Kreitewolf, Jens |
| SOCI 350 Statistics in Social Research | 3 | Fall 2024 | Torrisi, Orsola |
Future Trends in Spatial Analysis and Autocorrelation
The Future Trends in spatial analysis and autocorrelation are looking exciting. New tools like remote sensing are making data collection more accurate. It’s crucial to understand how these tools change geographic research.
Artificial intelligence is changing how we use spatial data. AI helps us spot patterns and predict outcomes, making spatial autocorrelation easier to grasp. This helps in making better decisions in areas like city planning and environmental care.
Citizen science is making a big impact on spatial analysis. By using data from the community, researchers can make their findings stronger. This teamwork brings together local knowledge with academic research.
These new tools are changing the way we study geography. We’re moving towards better, more open ways to understand the world around us. As we explore these changes, their effects on spatial analysis and autocorrelation are huge. New methods and community involvement are sparking important discussions on geographic issues.
In short, the future of Future Trends in spatial analysis and autocorrelation looks promising. With new tech and a focus on everyone’s input, we’re getting better at understanding spatial patterns. This progress opens up new areas for research and practical use, keeping geographic analysis key to smart decisions1821.
Conclusion
Understanding spatial autocorrelation is key to analyzing geographic patterns today and in the future. This Spatial Autocorrelation Summary shows how important it is to use tools like Geographic Information Systems (GIS). These tools help us see and understand data better.
Various examples in this article show how spatial analysis helps in making smart decisions. This is true for fields like urban planning and environmental management.
When thinking about these ideas, remember that using spatial analysis can greatly improve how we understand changing geographic patterns. New tools and methods are coming out, making planning and management more efficient. Being proactive with spatial autocorrelation is crucial for facing future challenges.
For more information, check out courses for future leaders in fields like environmental management. Courses like “Ecological Foundations for Environmental Managers” and “Natural Science Research: From Idea to Proposal” are available. These courses will help you make better decisions in spatial planning2223.
FAQ
What is spatial autocorrelation?
Spatial autocorrelation looks at how features or phenomena in a geographic area relate to each other. It helps us understand patterns, especially in cities and the environment.
How do Geographic Information Systems (GIS) assist with spatial autocorrelation?
GIS tools help us see, analyze, and make sense of spatial data. They’re great for mapping things like population changes and environmental shifts. This helps us spot patterns.
What methods are used in geospatial analysis?
Geospatial analysis uses methods like data exploration, basic statistics, and spatial models. These help us study how things are connected in space and understand geographic phenomena.
Why is spatial clustering important?
Spatial clustering is key because it shows where data points are close together. This info is vital for planning resources and city growth.
What is Moran’s I and how is it used?
Moran’s I measures spatial autocorrelation. It shows how connected a dataset is, helping us spot areas with similar or different values. This helps us grasp geographic patterns.
How does hotspot analysis work?
Hotspot analysis finds areas with lots of events, like crime or health issues. It uses spatial autocorrelation to highlight these spots. This helps in making better city plans.
What role does spatial autocorrelation play in environmental modeling?
Spatial autocorrelation helps predict natural resource patterns and climate change effects. It leads to more precise environmental forecasts and better conservation strategies.
What are some future trends in spatial analysis?
The future will bring more use of tech like machine learning and big data in spatial analysis. This will improve our understanding and use in city planning, health, and the environment.
How does spatial autocorrelation impact urban planning?
Knowing about spatial autocorrelation helps with city planning. It guides decisions on building projects, zoning, and resource use. This leads to more sustainable cities.
Source Links
- https://catalog.ncsu.edu/graduate/natural-resources/geospatial-analytics/
- https://catalog.odu.edu/courses/geog/
- https://catalog.uwec.edu/courses/geog/
- http://catalog.illinois.edu/courses-of-instruction/ggis/
- https://anyflip.com/pzwx/dwuu/basic
- http://collegecatalog.uchicago.edu/thecollege/geographicalstudies/
- https://uca.edu/gbulletin/courses/geography-and-gis/
- https://efteruddannelse.kurser.ku.dk/course/2024-2025/NIGK17011U
- https://www.bemidjistate.edu/academics/catalog/20253/courses/geog
- https://catalog.cwi.edu/course-descriptions/gis/gis.pdf
- http://esc.vscc.ac.ru/article/29595/full?_lang=en
- https://catalog.depaul.edu/course-descriptions/geo/
- https://www.gisci.org/Portals/0/PDF’s/GISP_Study_Guide_V1.1.pdf
- https://www.mdpi.com/2220-9964/13/1
- http://bulletin.du.edu/graduate/coursedescriptions/geog/
- https://catalog.colostate.edu/general-catalog/courses-az/stat/
- https://catalog.colorado.edu/courses-a-z/geog/
- http://catalog.okstate.edu/courses/geog/
- https://www.mcgill.ca/study/2024-2025/faculties/arts/undergraduate/programs/bachelor-arts-ba-honours-urban-studies
- https://student.mit.edu/catalog/m11c.html
- https://ecoforecast.org/workshops/statistical-methods-seminar-series/
- http://collegecatalog.uchicago.edu/thecollege/computationalsocialscience/
- https://environment.yale.edu/courses/