Published | Last updated
A crossover design compares treatments inside the same person, and the washout period is what keeps that comparison fair. This guide explains how the two-period design works, how to set a washout length, and how to analyse the result. We re-ran a published example, 13 children and two inhaled drugs, and the re-run shows both how efficient the design is and a trap in testing for carryover.
On this page: What it is · Four effects · Washout period · Worked example · Common mistake · Sample size · Reporting · FAQ
What a crossover design is, and when it fits
In a parallel-group trial each person receives one treatment, so the comparison is between people. In a crossover trial each person receives two or more treatments in a randomly assigned sequence, separated by a washout period, so the comparison is within each person [1]. The simplest form is the two-period, two-sequence design: half the participants get A then B, the other half get B then A [2]. Because each person is their own control, differences between people drop out of the comparison, and the design can reach the same precision with fewer participants [2].
It is popular for drug studies. A review of randomised trials published in December 2000 found that 116 publications were crossover trials, which gave 127 individual trials; 72% used the AB/BA design and the median sample size was 15 [1]. Those are old data, but they remain the most detailed audit of how crossover trials are reported.
The design suits stable, chronic conditions where the effect of a treatment is short-lived and reversible. It should not be used when the condition changes by itself or is cured in the first period [1,2]. Other limits are that all treatments fall on one person, that dropout and missing data are harder to handle than in a parallel trial, and that a drug with a long half-life makes the washout hard to arrange [2].
The four effects to separate before you trust a treatment effect
Lim and In list four things to check in a crossover analysis before interpreting the treatment effect [2]:
- Treatment effect: the direct effect of A compared with B. This is what you want.
- Period effect: responses differ between the first and second period whatever the treatment, because time has passed. The AB/BA design separates this from the treatment effect, because each treatment appears equally in both periods [2,3].
- Carryover effect: the first treatment continues into the second period and alters the response there [2].
- Sequence effect: the group a person was randomised to changes the results. Randomisation is what makes this assumption reasonable, but it cannot be verified from the data [2].
Wellek and Blettner make the central point: the main purpose of the design is to separate treatment effects from period effects, which requires analysing the two sequence groups separately. Crossover trials not analysed by sequence group are, in their words, of limited, if any, scientific value [3]. And the usual paired analysis is valid only if carryover can be ruled out [3].
How long should the washout period be?
Because carryover is hard to detect afterwards, the practical defence is a washout long enough that the first treatment has gone. Lim and In say it is better to choose a crossover design when carryover is medically unlikely or can be eliminated by a washout, rather than to rely on a statistical test to say it is absent [2].
For drugs, the length is set from the elimination half-life. The European Medicines Agency’s bioequivalence guideline states that “normally at least 5 elimination half-lives are necessary” so that concentrations are below the quantification limit in all subjects at the start of the second period [6]. Lim and In note that 3 to 4 times the half-life or more is sometimes used [2]. The guideline concerns bioequivalence studies, so for an efficacy trial the same logic applies but the clinical effect, not only the blood level, must have gone.
| Half-lives elapsed | Drug remaining | Example: half-life 12 hours |
|---|---|---|
| 1 | 50% | 12 hours |
| 2 | 25% | 24 hours |
| 3 | 12.5% | 36 hours |
| 4 | 6.25% | 48 hours |
| 5 | 3.1% | 60 hours (2.5 days) |
| 7 | 0.8% | 84 hours (3.5 days) |
The arithmetic is simple: after n half-lives a fraction 0.5n of the drug remains. Three half-lives leave 12.5%, five leave about 3%. Our practical advice is to work from the longest half-life that matters for your outcome, including any active metabolite, and to write the washout length and its reason into the protocol before enrolment.
A longer washout is not free. Lim and In point out that if the washout is too long, dropout in the second period can rise [2]. For non-drug treatments such as exercise or diet there is no half-life, so the washout must be justified from the time the effect takes to disappear in earlier studies.
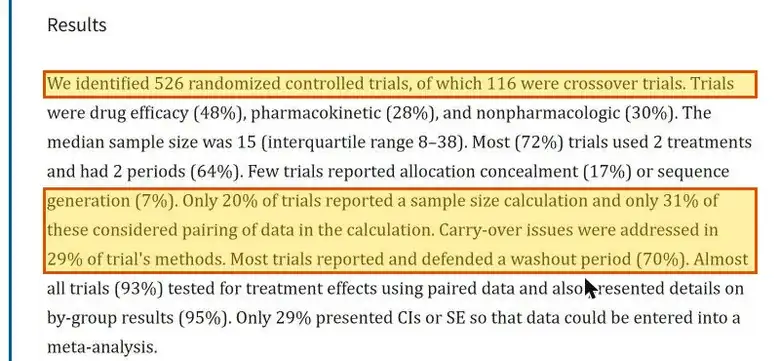
Many trials do not describe this clearly. In the 2009 audit, 70% of crossover trials either used a washout or explained its absence, yet carryover was addressed in the methods in only 29% [1].
Worked example: formoterol and salbutamol in 13 children
Lim and In analyse data originally published by Senn and Auclair: 13 children aged 7 to 14 received two bronchodilators, formoterol 12 µg and salbutamol 200 µg, in a two-period crossover with a washout of at least one day. Seven were randomised to formoterol then salbutamol and six to the reverse. Peak expiratory flow was measured 8 hours after each inhalation [2,5]. The table prints all 26 readings as given in the paper [2].
| Child | Sequence | Period 1 (L/min) | Period 2 (L/min) | Formoterol − salbutamol |
|---|---|---|---|---|
| 1 | formoterol then salbutamol | 310 | 270 | +40 |
| 4 | formoterol then salbutamol | 310 | 260 | +50 |
| 6 | formoterol then salbutamol | 370 | 300 | +70 |
| 7 | formoterol then salbutamol | 410 | 390 | +20 |
| 10 | formoterol then salbutamol | 250 | 210 | +40 |
| 11 | formoterol then salbutamol | 380 | 350 | +30 |
| 14 | formoterol then salbutamol | 330 | 365 | −35 |
| 2 | salbutamol then formoterol | 370 | 385 | +15 |
| 3 | salbutamol then formoterol | 310 | 400 | +90 |
| 5 | salbutamol then formoterol | 380 | 410 | +30 |
| 9 | salbutamol then formoterol | 290 | 320 | +30 |
| 12 | salbutamol then formoterol | 260 | 340 | +80 |
| 13 | salbutamol then formoterol | 90 | 220 | +130 |
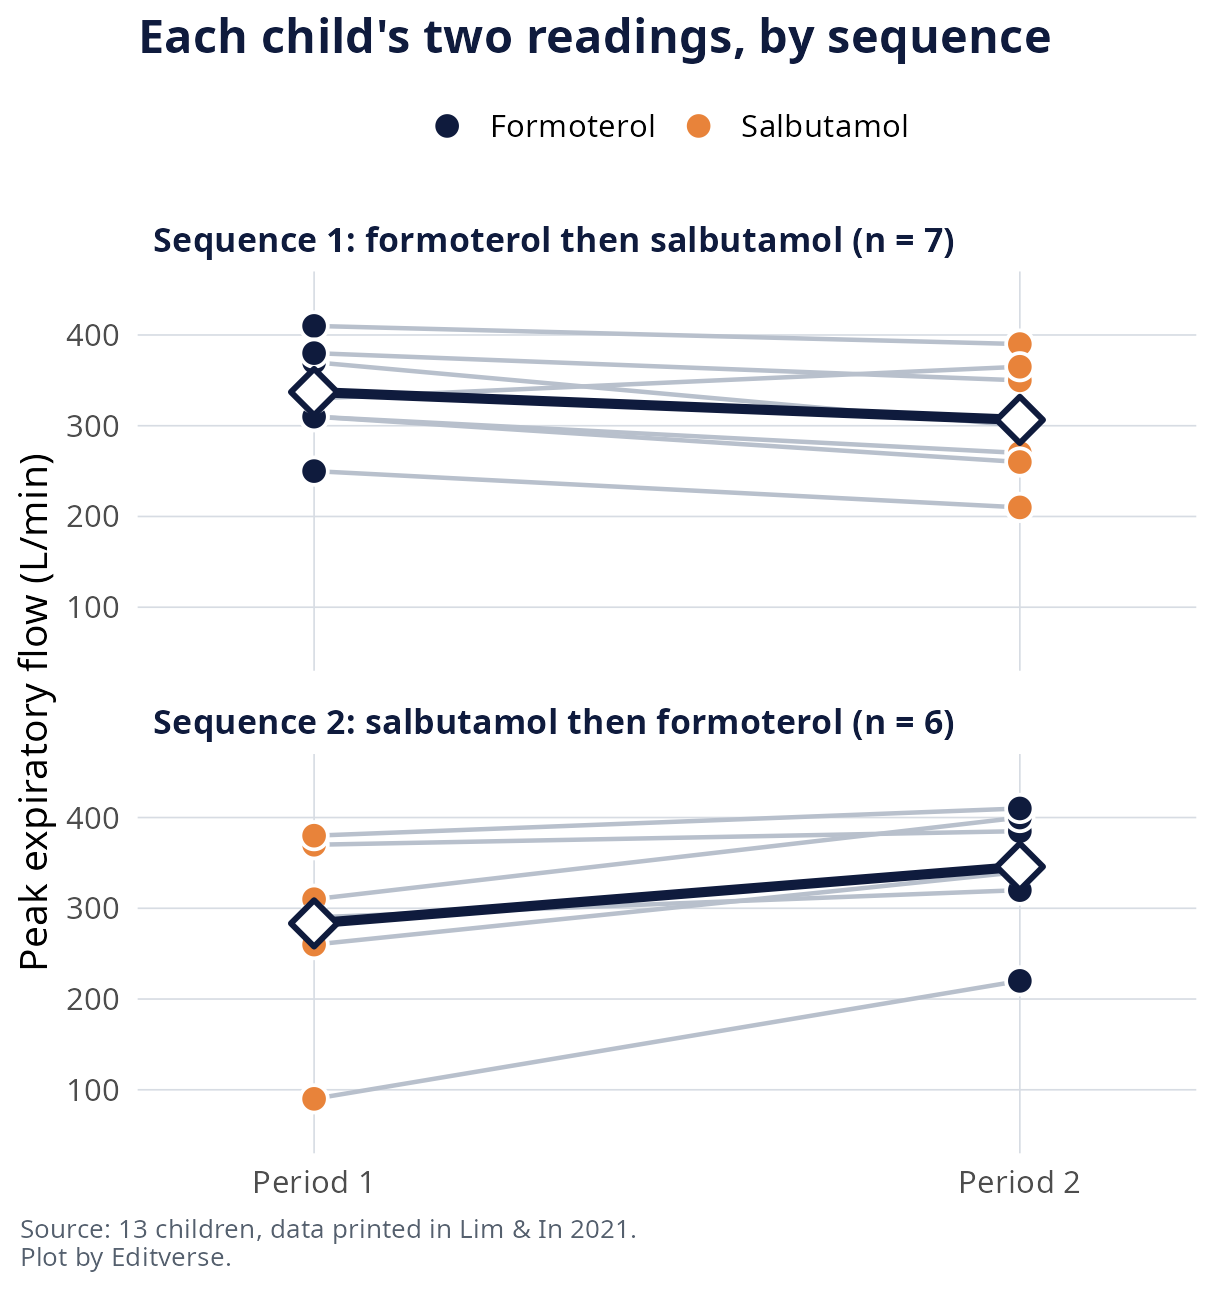
We re-ran the analysis in R with a mixed model: sequence, period and treatment as fixed effects and a random intercept for each child. The treatment effect is 46.6 L/min in favour of formoterol, with a 95% confidence interval of 22.9 to 70.3 L/min. This matches the interval printed in the paper [2]. The period effect is not significant (F = 2.17, P = 0.168). The table sets our numbers beside the printed ones.
| Quantity | Our recalculation (R) | Printed in Lim and In | Comment |
|---|---|---|---|
| Treatment effect, formoterol − salbutamol | 46.6 L/min, 95% CI 22.9 to 70.3 | 46.6, 95% CI 22.9 to 70.3 | Same |
| P value, treatment | 0.0012 | 0.001 in Table 1; 0.012 in the text | Text value differs by a factor of 10 |
| Period effect | F = 2.17, P = 0.168 | F = 2.17, P = 0.168 | Same |
| Carryover test | F = 0.03, P = 0.86 | F = 0.45, P = 0.518 | Printed F divides by the within-subject error; see below |
| Treatment effect from first period only | 54 L/min, 95% CI −46 to 153, P = 0.26 | Not reported | CI is 199 wide, against 47 for the full crossover analysis |
The code behind it is short:
library(nlme)
# pef: peak flow; seq: AB or BA; per: period 1/2; trt: formoterol or salbutamol
fit <- lme(pef ~ seq + per + trt, random = ~ 1 | subj, data = d)
summary(fit)$tTable     # trt = treatment effect, per = period effect
intervals(fit, which = "fixed")

# carryover: compare the two sequences on each child's period total,
# using between-subject variation (a t test on the sums)
d_wide$total <- d_wide$p1 + d_wide$p2
t.test(total ~ seq, data = d_wide, var.equal = TRUE)
One more point from the plot: the children vary a lot. Peak flow runs from 90 to 410 L/min across children, much more than the difference between drugs. A parallel trial would have to carry all that between-child noise; the crossover removes it.
Common mistake: testing carryover against the wrong error term
The published ANOVA table shows how easily this happens. Figure 2 is Table 1 of Lim and In as displayed on PubMed Central on 28 October 2026. The carryover mean square is 335 and the printed F is 0.45, which equals 335 divided by 750, the within-subject residual. But the between-subject residual in the same table is 10,443. The correct F is 335 / 10,443 = 0.03, with 1 and 11 degrees of freedom, P = 0.86. We reproduced this with a mixed model, a sequence-total t test and a direct ANOVA; all three give P = 0.86 [2].
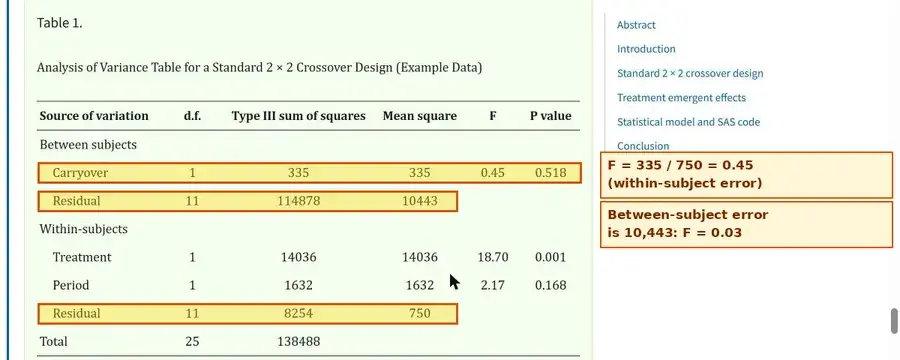
The conclusion does not change: no carryover is detected either way, and the treatment result is unaffected. The text of the paper also gives the treatment P value as 0.012 while its own table, and our recalculation, give 0.001. What matters for your own work is the principle. Check which error term your software uses for each effect, and be wary of any carryover test in a small trial.
The cost of a real carryover problem would be large. If carryover cannot be excluded, Wellek and Blettner say the treatment effect must be analysed from the first period alone, and even that restricted analysis has validity concerns [3]. In this dataset the first-period-only difference is 54 L/min with a 95% confidence interval of −46 to 153 L/min (P = 0.26). The full crossover interval is 47 L/min wide; the first-period-only interval is 199 L/min wide, about four times wider. That gap is why a washout planned in advance is worth far more than a test afterwards.
Sample size: why the design saves participants
Using the spread in this dataset as a rough guide, we can show the saving. The standard deviation of the within-child differences between drugs is 40.6 L/min. To detect a 30 L/min difference with 80% power at a two-sided 5% level, a paired (crossover) analysis needs about 17 children. A parallel trial using each child’s first-period reading, whose pooled standard deviation is 83.7 L/min, needs about 124 per group, 248 in total [2]. These figures are illustrative: the standard deviations come from only 13 children and are themselves imprecise, so a real protocol should take them from a larger source and use a calculator.
The 2009 audit found that only 20% of crossover trials reported a sample size calculation, and only 31% of those allowed for the pairing of the data [1]. If you plan one, our free sample size calculator and the step-by-step guide cover the basics.
What to report in a crossover trial
The 2009 audit of trials published in December 2000 found large gaps in reporting (Figure 3) [1]. The table shows the main ones.
| What was reported | Share of 127 crossover trials | Count |
|---|---|---|
| Washout used, or its absence explained | 70% | 87 of 127 |
| Carryover addressed in the methods | 29% | 37 of 127 |
| Formal test for carryover described or used | 17% | 22 of 127 |
| Allocation concealment reported | 17% | 22 of 127 |
| Prospective sample size calculation | 20% | 26 of 127 |
| Confidence interval or standard error given | 29% | 38 of 127 |
| CONSORT-style patient flow diagram | 2% | 3 of 127 |
The authors called for reporting standards [1], and these arrived in 2019 as the CONSORT 2010 extension for randomised crossover trials, which revises the checklist and adds a modified flow diagram and a baseline table [4]. A clear crossover report should state:
- the design (AB/BA or other), the number of periods and sequences, and how participants were randomised to sequence;
- the washout length and the reason for it;
- how period and carryover were handled in the analysis;
- the treatment effect as a within-person difference with its confidence interval;
- a flow diagram that shows dropout at each period (our Flowchart Pro makes CONSORT-style diagrams);
- the sample size calculation, including the within-person variation used.
To choose the test itself, see our guides to choosing the right statistical test and the t-test, p-value and effect size.
Free tools for your crossover study
These Editverse tools are free and need no signup.
- GraphPro: build publication-ready charts, 25 types, with built-in t-test, ANOVA, correlation, and chi-square p-values. Free, no signup.
- StatPro: free statistical calculators and a test-selector tool covering group comparisons, categorical outcomes, time-to-event analysis, and diagnostic accuracy.
- Flowchart Pro: generate PRISMA 2020, PRISMA-ScR, CONSORT, STROBE, STARD, MOOSE, and ARRIVE flow diagrams directly in your browser.
- Sample Size Calculator: power analysis for your trial, free.
Related Editverse guides
Get your trial design and analysis checked
If you need the crossover analysis, assumption checks, tables and a methods paragraph for your manuscript, this is the service built for it.

Planning or analysing a crossover trial? A PhD biostatistician checks your design, runs the period, carryover and treatment analysis with the right error terms, and writes the statistical methods paragraph for your manuscript, with revisions included for 60 days.
Crossover design and washout period FAQ
What is a crossover design?
In a crossover design every participant receives two or more treatments in a random order, usually separated by a washout period, so each person acts as their own control. The simplest version is the two-period, two-sequence (AB/BA) design [1,2].
What is a washout period in a crossover trial?
The washout period is the gap between treatment periods that lets the effect of the first treatment fade, so it cannot distort the second. Its length should be set in advance from how long the treatment’s effect lasts [1,2].
How long should a washout period be?
It depends on the treatment. For drugs, the EMA bioequivalence guideline says that normally at least 5 elimination half-lives are necessary, and a review in the Korean Journal of Anesthesiology notes that 3 to 4 half-lives or more are sometimes used [2,6]. Five half-lives leave about 3% of the drug.
What is a carryover effect?
A carryover effect is the effect of the first treatment continuing into the second period and changing the response to the second treatment. In an AB/BA design it cannot be separated cleanly from other effects, so the best protection is a washout long enough to prevent it [2,3].
What is the difference between a period effect and a carryover effect?
A period effect means responses differ between the first and second period whatever the treatment, for example because of time, season or learning. A carryover effect means the first treatment changes the second period’s response. The AB/BA design separates treatment from period effects; carryover must be prevented by design [2,3].
Can I test for carryover and carry on if it is not significant?
Be careful. The carryover test compares the two sequences using between-subject variation, so it has little power in small trials, and a non-significant result does not prove there is none. Reviewers of the design advise choosing a crossover design only when carryover is medically unlikely or a washout can remove it [1,2,3].
What should I do if carryover is present?
Wellek and Blettner advise that if ignoring carryover is not justified, the treatment effect must be analysed using only the first-period data, which gives a valid but much less precise result [3]. In the example below the first-period-only interval is about four times wider.
When should I not use a crossover design?
Avoid it when the condition changes by itself or is cured during the first period, when the effect of the treatment is long-lasting or irreversible, or when a long washout would cause many dropouts. It fits stable, chronic conditions best [1,2].
Is there a reporting guideline for crossover trials?
Yes. The CONSORT 2010 extension to randomised crossover trials, published in 2019, revises the checklist and adds a modified flow diagram and baseline table [4].
Conclusion
A crossover design gives precision that parallel trials cannot match for the same number of people, but only if carryover is prevented rather than tested for afterwards. Set the washout from the elimination half-life, write the reason down before enrolment, analyse by sequence, and report the washout, the period and carryover handling and the within-person difference with its interval [1,2,3,4,6]. For help with the design or analysis, see our statistical analysis and review service.
References
- Mills EJ, Chan A-W, Wu P, Vail A, Guyatt GH, Altman DG (2009). Design, analysis, and presentation of crossover trials. Trials 10:27. 10.1186/1745-6215-10-27
- Lim C-Y, In J (2021). Considerations for crossover design in clinical study. Korean J Anesthesiol 74(4):293-299. 10.4097/kja.21165
- Wellek S, Blettner M (2012). On the proper use of the crossover design in clinical trials: part 18 of a series on evaluation of scientific publications. Dtsch Arztebl Int 109(15):276-281. 10.3238/arztebl.2012.0276
- Dwan K, Li T, Altman DG, Elbourne D (2019). CONSORT 2010 statement: extension to randomised crossover trials. BMJ 366:l4378. 10.1136/bmj.l4378
- Senn SJ, Auclair P (1990). The graphical representation of clinical trials with particular reference to measurements over time. Stat Med 9(11):1287-1302. 10.1002/sim.4780091108
- European Medicines Agency. Guideline on the Investigation of Bioequivalence, CPMP/EWP/QWP/1401/98 Rev. 1, section 4.1.1. Adopted by the CHMP 20 January 2010, in effect 1 August 2010 (read 28 October 2026). ema.europa.eu, CPMP/EWP/QWP/1401/98 Rev. 1