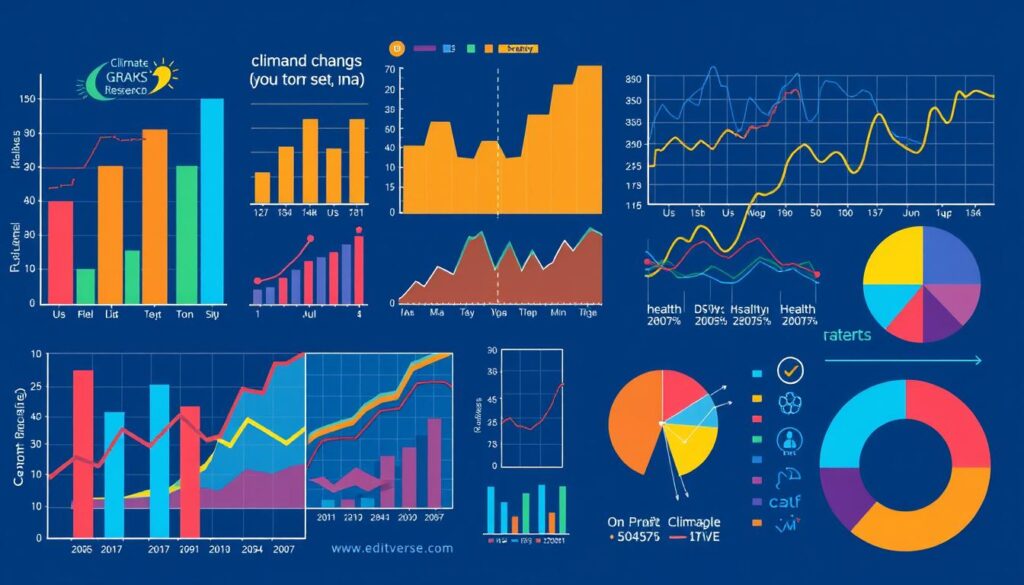
Discover how clinical data visualization revolutionizes research. We explore 15 techniques to enhance data interpretation and presentation.


Discover how clinical data visualization revolutionizes research. We explore 15 techniques to enhance data interpretation and presentation.

Master python medical data analysis with our step-by-step guide. Learn to streamline your research data processing and improve publication quality.

Revolutionize your online academic publishing in 2025-2026 with our interactive graphs that captivate readers through dynamic data visualization.

Leverage compound graphs and advanced visualization methods to present your research findings with impact. Unlock success in high-impact journal publication.

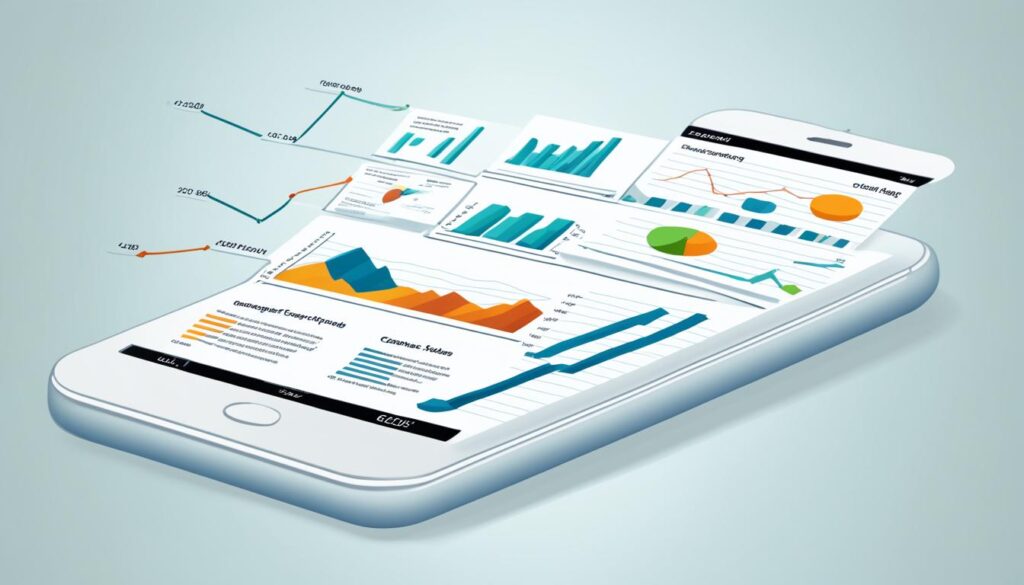
Discover how mobile-optimized graphs are revolutionizing academic reading. Learn to adapt your research for the digital age with our expert insights and strategies.