
Published | Last updated
A trial coordinator finishes entering data on 400 post-surgical patients and faces a practical question. Which of the fifteen variables recorded at baseline actually predict who is readmitted, who develops a complication, or who survives five years past diagnosis? Regression models in medical research answer exactly that question. They estimate how one or more predictors relate to an outcome while holding the other predictors steady, separating a real signal from noise that a simple two-group comparison would miss entirely.
Four families of these models cover most of what appears in clinical journals today, and each exists because a different outcome type needs its own mathematics. Blood pressure and other continuous numbers need linear regression. A yes/no event like 30-day mortality needs logistic regression. A count such as the number of falls in a nursing home needs Poisson or negative binomial regression, and a time-to-event outcome like relapse-free survival needs Cox regression. This guide walks through all four, covers how many predictors a dataset can actually support, and closes with what reviewers now expect to see reported alongside every model.
In Simple Words
A regression model is a way to ask “does this factor matter, and by how much, once I account for everything else I measured?” Every version works the same way underneath. You pick an outcome, you list the predictors you think might explain it, and the model estimates a number for each predictor showing its independent relationship with that outcome. Which version you use depends only on what kind of outcome you have. A number gets linear regression, a yes/no event gets logistic regression, a count gets Poisson or negative binomial regression, and a time until an event gets Cox regression. Pick the wrong one and the coefficients the software prints out will not mean what you think they mean.
What Regression Models Do in Medical Research
Every regression model splits variables into two roles, an outcome and a set of predictors. Researchers call the outcome the dependent variable, the thing a study wants to explain or predict, such as hospital readmission or systolic blood pressure. Age, treatment group, and baseline creatinine become predictors instead, also called independent variables or covariates, the factors that might influence that outcome. A model estimates a coefficient for each predictor that describes its relationship with the outcome while the other predictors in the equation are held fixed.
That last part is the entire reason clinical researchers reach for regression instead of a simple t-test or chi-square test. A t-test can show that a treatment group and a control group differ in outcome. A t-test cannot tell you whether that difference survives once age, sex, disease severity, and comorbidity count are all accounted for at the same time. Regression can, which is why it sits underneath most adjusted analyses, risk calculators, and prognostic models published in medical journals. Choosing among the available statistical tests for a given research question starts with identifying the outcome type, and that same classification decides which regression family applies.
Six Regression Models Used in Medical Research at a Glance
Six models below account for the overwhelming majority of regression analyses published in clinical and epidemiological journals, each paired with the outcome type it handles and the assumption most likely to get violated in practice.
| Model | Outcome Type | Coefficient Interpreted As | Assumption Most Often Violated |
|---|---|---|---|
| Linear regression | Continuous (blood pressure, lab value, score) | Unit change in the outcome per unit change in the predictor | Constant variance of residuals across fitted values (homoscedasticity) |
| Logistic regression | Binary (event occurred or not) | Odds ratio per unit change in the predictor | Adequate events per variable relative to sample size |
| Poisson regression | Count (falls, infections, hospitalizations per period) | Incidence rate ratio per unit change in the predictor | Equidispersion, meaning the variance equals the mean |
| Negative binomial regression | Overdispersed count data | Incidence rate ratio, with an added dispersion parameter | Still assumes the same rate structure across all subjects |
| Cox proportional hazards regression | Time-to-event (survival, relapse, time to discharge) | Hazard ratio per unit change in the predictor | Proportional hazards held constant over the entire follow-up |
| Ordinal / multinomial logistic regression | Ordered or unordered categories (three or more) | Odds ratio per category threshold or per category versus a reference | Proportional odds across thresholds (ordinal version only) |
Linear Regression for Continuous Outcomes
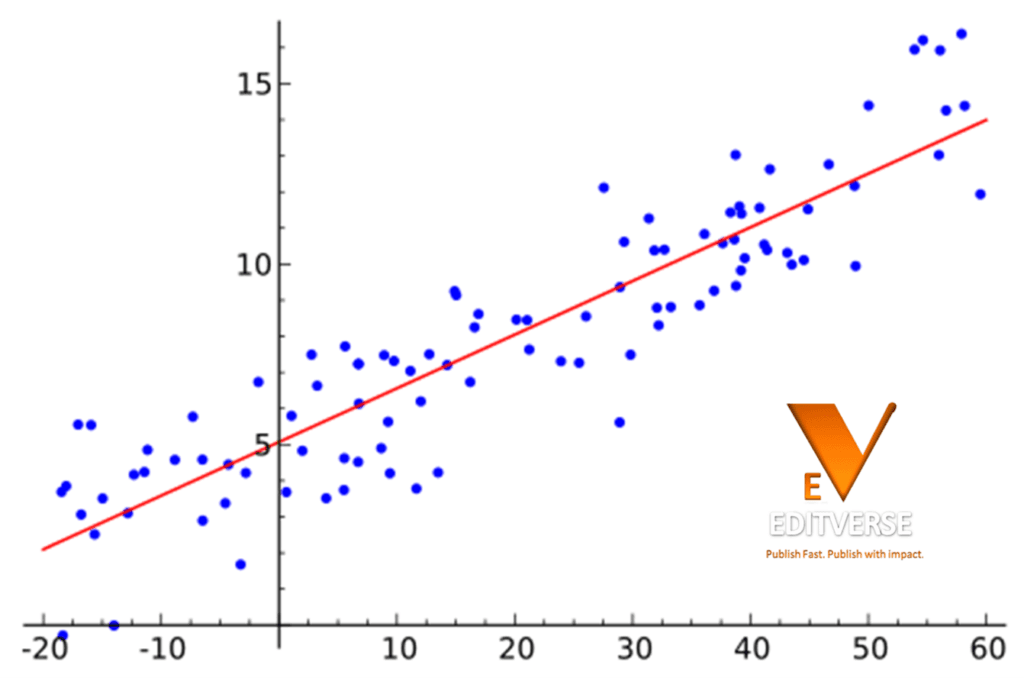
Linear regression fits a straight-line relationship between one or more predictors and a continuous outcome. Each coefficient represents the expected change in the outcome for a one-unit increase in that predictor, holding the rest of the model constant. A coefficient of 2.3 for age in a model predicting systolic blood pressure means the model expects a 2.3 mm Hg higher reading for every additional year of age, all other included variables being equal.
Four assumptions hold this method together, and a residual plot can check all of them directly. Predictors and outcome need a linear relationship rather than a curved one, observations need independence from each other, residuals need something close to a normal distribution, and their spread needs to stay roughly constant across the range of fitted values. A 2020 Scientific Reports analysis built on the NIH Osteoarthritis Initiative cohort illustrates how linear and logistic regression often get used side by side in the same study. Researchers tested 19 candidate biomarkers against radiographic and clinical features of knee osteoarthritis and found that only four, serum Coll2-1 NO2, CS846, COMP, and urinary CTXII, held up as independent predictors once the models adjusted for established risk factors, out of a disease affecting more than 500 million people worldwide.
Logistic Regression for Binary Outcomes
Logistic regression handles outcomes with two possible states, a complication that either happens or does not, a test that comes back positive or negative, a patient who survives to discharge or does not. Rather than modeling the outcome directly, it models the log-odds of the event as a linear function of the predictors, which keeps the predicted probability bounded between 0 and 1 no matter how extreme the predictor values get. Exponentiating a coefficient converts it into an odds ratio, the standard way clinical papers report logistic regression results.
Most published papers treat a logistic model as routine once it runs without errors, but getting it right takes more care than that. A 2017 audit in the journal Medicine reviewed 316 articles published across five high-impact Chinese clinical journals between 2010 and 2015 that used multivariable logistic regression, scoring each against 12 established reporting and methodological criteria. Scoring came out low across the board, a median of 5 out of 12, and 85.1% of the articles below 6, meaning most published models fell short on basics like reporting how variables were selected or checking whether the model actually fit the data. Logistic regression case studies covering odds ratio interpretation and ROC curve evaluation go deeper into how to read and validate this output once a model is fitted, and pairing a logistic model with the right sensitivity, specificity, and predictive value calculations is what turns a set of odds ratios into a usable diagnostic or prognostic tool.
Poisson and Negative Binomial Regression for Count Outcomes
Count outcomes, the number of falls a patient has in a year, the number of hospital-acquired infections on a ward, the number of emergency visits after discharge, do not fit comfortably into either linear or logistic regression. Poisson regression is the standard starting point, modeling the log of the expected count as a function of the predictors and reporting results as incidence rate ratios. Poisson regression carries one assumption that fails constantly in real clinical data, that the variance of the counts equals the mean, a property called equidispersion.
Real medical data are almost always overdispersed instead, with more spread than a Poisson model expects, and pretending otherwise produces standard errors that are too small and p-values that look more impressive than they should. A 2022 comparison published in BMC Medical Research Methodology tested Poisson, negative binomial, and zero-inflated versions of both against hospital length-of-stay data drawn from the MIMIC intensive care database. Plain Poisson and zero-inflated Poisson models fit the overdispersed length-of-stay data poorly, while the negative binomial model gave the best overall fit and avoided the inflated significance that comes from forcing an equidispersion assumption onto data that do not meet it. When a count variable is the outcome, checking the variance against the mean before choosing between Poisson and negative binomial is not optional.
Cox Proportional Hazards Regression for Time-to-Event Outcomes
Time-to-event outcomes need a fourth family entirely, because they involve two pieces of information at once, whether an event happened and how long it took, plus the complication that some patients leave a study before the event occurs or before follow-up ends (censoring). Cox proportional hazards regression models the hazard, the instantaneous risk of the event at a given moment, as a function of the predictors, without requiring an assumption about the underlying shape of the survival curve itself. Coefficients are reported as hazard ratios, and the model’s core assumption is that the ratio of hazards between any two groups stays constant across the entire follow-up period.
A phase 3 trial run at 33 hospitals in Japan shows what a Cox-derived hazard ratio looks like in practice. The JASPAC-01 trial randomized 385 patients with resected pancreatic cancer to adjuvant gemcitabine or S-1, and a Cox model estimated the mortality hazard ratio for S-1 versus gemcitabine at 0.57, with a 95% confidence interval of 0.44 to 0.72. That translates to roughly 43% lower hazard of death at any given point during follow-up for patients on S-1, consistent with the 5-year overall survival of 44.1% in the S-1 group against 24.4% with gemcitabine. Cox proportional hazards modeling covered in full, including how hazard functions and covariates interact, and survival analysis fundamentals for clinical research both build directly on the mechanics summarized here.
Ordinal and Multinomial Regression for Outcomes With More Than Two Categories
Some outcomes do not reduce cleanly to a yes/no split. Pain severity scored as none, mild, moderate, or severe is ordinal, meaning the categories have a natural order. Treatment response classified as complete, partial, or no response without a numeric scale is also ordinal. Response to one of three unrelated treatment options with no inherent ranking is nominal instead, which calls for multinomial rather than ordinal logistic regression.
Ordinal logistic regression, most often fitted as a proportional odds model, assumes the relationship between each predictor and the odds of moving up a category is the same regardless of which threshold is being crossed, an assumption worth testing rather than accepting by default. Multinomial logistic regression drops that requirement and instead estimates a separate set of odds ratios for each category against a reference category, at the cost of needing a larger sample to estimate all of those parameters with any precision. Collapsing an ordinal outcome into a binary one to sidestep the choice, moderate-or-worse versus mild-or-none, is common in practice but throws away information the original scale was designed to capture.
How Many Predictors Your Regression Model Can Support
A dataset does not support an unlimited number of predictors no matter how large the sample looks. For logistic and Cox models, the long-standing rule of thumb calls for at least 10 events, not 10 subjects, per predictor variable, where an event means a death, a complication, or whatever the outcome represents. The rule traces back to a 1996 Monte Carlo simulation built on a real cardiac trial of 673 patients with 252 deaths and seven candidate predictors, an events-per-variable ratio of 36 for the full sample. Resampling that dataset down to ratios as low as 2 events per variable, the researchers found that below an EPV of about 10, coefficients became biased in both directions, confidence intervals stopped covering the true value at their stated rate, and statistically significant associations pointing the wrong way turned up more often than they should.
Modern guidance has moved past a single ratio entirely. A 2019 methods paper in Statistics in Medicine proposed four numerical targets a sample size needs to clear together for continuous-outcome prediction models, limiting the shrinkage of predictor effects to no worse than a factor of 0.9, keeping the gap between a model’s apparent and optimism-adjusted R-squared under 0.05, and holding the margin of error under 10% for both the residual standard deviation and the predicted mean outcome. In a worked example predicting lung function in African-American women from 25 predictor parameters, meeting all four criteria required at least 918 subjects, working out to roughly 37 subjects per predictor parameter, well above what any simple EPV shortcut would have suggested. Extensions of the same four-criteria logic now cover binary, time-to-event, and multinomial outcomes as well. Running an a priori power analysis and sample size calculation before data collection begins is the only way to know which side of these thresholds a planned study will land on.
Checking Whether Your Regression Model’s Assumptions Hold
Fitting a regression model and reading off the coefficients without checking the assumptions behind them is one of the more common ways a published analysis goes wrong. Multicollinearity, where two or more predictors carry overlapping information, inflates standard errors and makes individual coefficients unstable even when the model as a whole fits well. A variance inflation factor above 5 or 10 for any predictor is the usual trigger to reconsider the variable list. Multivariable regression approaches for controlling confounders in clinical studies depend on this kind of diagnostic work being done before the results are trusted, not after.
Each model family carries its own specific check on top of the general ones. Linear regression needs a residuals-versus-fitted-values plot to catch non-linearity and unequal variance, plus a Q-Q plot for the normality assumption. Logistic regression benefits from a Hosmer-Lemeshow test or a calibration plot comparing predicted to observed probabilities across risk deciles. Cox regression has a specific and non-optional check, testing Schoenfeld residuals against time to confirm the proportional hazards assumption actually holds rather than assuming it does, since a hazard ratio reported for a covariate that violates proportionality is not really a single number at all. Handling how a dataset deals with missing data before it reaches the regression model matters just as much, since case-deletion of any subject with a missing predictor can quietly bias every coefficient in the model, not just the ones for the incomplete variable. Studies with a clustered or nested structure, patients within hospitals or repeated visits within patients, need a further step into multilevel or mixed-effects modeling, since standard regression assumes every observation is independent of every other one.
Reporting Regression Models So Reviewers and Readers Can Trust Them
A regression coefficient means little to a reader who cannot see how the model behind it was built. The TRIPOD statement, published simultaneously in 2015 across eleven journals including The BMJ, Annals of Internal Medicine, and Circulation, lays out a 22-item checklist covering how predictors were selected, how missing data were handled, how the model was validated, and how its performance was measured, developed through a three-day methodologist meeting and refined over the following years by the wider TRIPOD steering group. A 2024 update, TRIPOD+AI, extended the same checklist to prediction models built with machine-learning methods alongside traditional regression.
Reporting-quality numbers from the Chinese logistic regression audit cited earlier are not an isolated finding. Studies developing or validating a prediction model routinely omit how a candidate predictor list was narrowed down, skip reporting the number of events relative to the number of variables, or present a hazard ratio without ever mentioning whether the proportional hazards assumption was tested. None of that is exotic statistical territory. That gap is a documentation habit, and the TRIPOD checklist exists specifically to make it visible to a reviewer before publication rather than to a reader trying to reproduce the result afterward. Statistical significance and p-value reporting deserve the same transparency, since a regression coefficient’s p-value means something different depending on how many other variables and comparisons were tested along the way to that final model.
Common Mistakes That Undermine Regression Models in Medical Research
- Automated stepwise variable selection. Letting software add and drop predictors based on p-value thresholds inflates the apparent significance of whatever survives and produces confidence intervals that no longer mean what they claim to mean. Predictors belong in a model because clinical reasoning or prior literature put them there, not because a stepwise algorithm kept them.
- Ignoring events per variable until a reviewer asks. Fitting a 12-predictor logistic model against 40 events produces coefficients no more trustworthy than a coin flip for several of those predictors, regardless of how large the overall sample size looks on the title page.
- Reporting an odds ratio as if it were a risk ratio. Odds ratios and risk ratios converge only when the outcome is rare, typically under 10%. Above that, an odds ratio systematically overstates the associated risk, and readers who convert it directly into a risk ratio in their heads will overestimate the effect.
- Treating an ordinal outcome as continuous. Running linear regression on a 5-point symptom scale assumes the distance between “none” and “mild” equals the distance between “moderate” and “severe,” an assumption ordinal regression does not require and rarely holds.
- Never testing the proportional hazards assumption. A hazard ratio reported without a Schoenfeld residuals check, or an equivalent test, may be averaging over an effect that changes substantially across the follow-up period, which the single reported number will not reveal on its own.
- Extrapolating a fitted model beyond the range of the data used to build it. A regression equation built on patients aged 40 to 75 makes no promises about a 25-year-old or a 90-year-old, no matter how linear the relationship looks within the studied range.
Getting Statistical Support for Regression Models in Medical Research
Some regression analyses are routine, a single logistic model with five well-chosen predictors and an adequate event count. Others involve competing risks, time-varying covariates, clustered data, or a predictor list that needs trimming before the model can even be fitted responsibly. Editverse’s statisticians handle the full range, from checking whether a planned analysis has enough events per variable to writing the results narrative a dissertation committee or journal reviewer will actually read.
Dissertation & Manuscript Statistical Analysis
$600
PhD statisticians handle regression model selection, assumption testing, and full analysis writeups in SPSS, R, or STATA.
Manuscript Writing Services
Custom Quote
Turn a completed regression analysis into a submission-ready methods and results section written to journal standards.
Frequently Asked Questions About Regression Models in Medical Research
How do I choose between linear, logistic, Poisson, and Cox regression?
The choice depends entirely on the outcome variable. A continuous number such as a lab value or a score calls for linear regression. A binary yes/no outcome calls for logistic regression. A count, such as the number of falls or infections over a fixed period, calls for Poisson or negative binomial regression. A time-to-event outcome that includes patients who leave the study before the event happens calls for Cox proportional hazards regression. Getting this classification right comes before any other modeling decision.
What does an odds ratio of 2.0 actually mean?
An odds ratio of 2.0 for a predictor means the odds of the outcome double for each one-unit increase in that predictor, holding the other variables in the model constant. That is not the same as saying the outcome is twice as likely in an absolute sense. Odds and probability only converge when the outcome is rare, so an odds ratio of 2.0 for a common outcome corresponds to a smaller increase in actual risk than the number suggests at first glance.
How many events per variable does a regression model need?
Ten events per predictor variable is the traditional benchmark for logistic and Cox regression, based on a 1996 simulation showing that coefficients became biased and confidence intervals lost accurate coverage below that ratio. More recent research has shown that the true minimum depends on total sample size and how well the predictors separate the outcome, not on the EPV ratio in isolation, so treat 10 EPV as a floor to check rather than a target to aim for exactly.
What is the difference between multivariable and multivariate regression?
Multivariable regression refers to a model with multiple predictor variables and a single outcome, which describes the vast majority of regression models used in medical research. Multivariate regression, in the strict statistical sense, refers to a model with multiple outcome variables analyzed simultaneously. Both terms get used interchangeably in much of the applied medical literature, but reviewers at methodologically strict journals increasingly expect the precise term.
Why does my Cox model need a proportional hazards check?
Cox regression assumes the hazard ratio between any two groups stays constant across the entire follow-up period. If the true effect of a predictor changes over time, for example a surgical treatment that lowers risk early but not later, a single hazard ratio averages over that change and can misrepresent the effect at any specific time point. A Schoenfeld residuals test checks this assumption directly rather than leaving it to be assumed.
Can I use regression with a small sample size?
Regression can technically run on almost any sample size, but the results become unstable once the number of predictors approaches the number of events (for binary or time-to-event outcomes) or the number of subjects (for continuous outcomes). A practical fix reduces the predictor list to variables with strong clinical justification, uses penalized regression methods designed for smaller samples, or runs an a priori sample size calculation before committing to a model with a given number of predictors.
What is TRIPOD and do I need to follow it?
TRIPOD, short for Transparent Reporting of a multivariable prediction model for Individual Prognosis Or Diagnosis, is a 22-item reporting checklist for studies that develop or validate a prediction model. Most major clinical and methodological journals now expect a completed TRIPOD checklist alongside any manuscript reporting a regression-based prediction model, and reviewers increasingly check submissions against it directly.
Should I combine several regression models in one study?
Combining models is common and often appropriate. A study might use logistic regression to identify predictors of a complication and Cox regression to separately model time to recovery in the same patient cohort. What matters is that each model matches its own outcome type and that the paper reports each model’s assumptions, sample size, and events per variable independently rather than treating one power or sample size justification as covering every model in the paper.
Key Takeaways
- ✓ The outcome type, continuous, binary, count, or time-to-event, determines which regression family applies before any other decision gets made
- ✓ Ten events per predictor variable is a floor worth checking for logistic and Cox models, not a guarantee of a stable model on its own
- ✓ Overdispersed count data need negative binomial regression; forcing a Poisson model onto it overstates significance
- ✓ A Cox model’s hazard ratio is only meaningful once the proportional hazards assumption has actually been tested, not assumed
- ✓ Automated stepwise selection inflates significance and should give way to predictors chosen on clinical grounds
- ✓ The TRIPOD checklist, now extended by TRIPOD+AI, is what reviewers increasingly check regression-based prediction models against
- ✓ Multicollinearity, missing data handling, and clustered data structure all need their own diagnostic checks separate from the headline model results
Need Help Choosing or Running the Right Regression Model?
Editverse’s PhD statisticians handle model selection, assumption testing, and results reporting for dissertations, manuscripts, and grant applications across every clinical discipline.
Related Editverse Resources
→ Logistic Regression in Medical Diagnostics: Case Studies and Interpretations
→ Cox Proportional Hazards Model: Illustrated Guide for Chronic Disease Research
→ Multivariable Regression in Clinical Studies
→ Understanding Survival Analysis in Clinical Research
→ Power Analysis Made Easy: Sample Size Calculations with Examples
→ Statistical Tests Guide: Making the Right Choice
→ Dealing with Missing Data: Strategies & Tips
→ Master Cluster Randomized Trials & Multi-level Modeling
References
- Collins GS, Reitsma JB, Altman DG, Moons KGM. Transparent reporting of a multivariable prediction model for individual prognosis or diagnosis (TRIPOD): the TRIPOD statement. BMJ. 2015;350:g7594. https://pubmed.ncbi.nlm.nih.gov/25569120/
- Peduzzi P, Concato J, Kemper E, Holford TR, Feinstein AR. A simulation study of the number of events per variable in logistic regression analysis. J Clin Epidemiol. 1996;49(12):1373-1379. https://pubmed.ncbi.nlm.nih.gov/8970487/
- van Smeden M, de Groot JAH, Moons KGM, Collins GS, Altman DG, Eijkemans MJC, Reitsma JB. No rationale for 1 variable per 10 events criterion for binary logistic regression analysis. BMC Med Res Methodol. 2016;16(1):163. https://pubmed.ncbi.nlm.nih.gov/27881078/
- Riley RD, Snell KIE, Ensor J, Burke DL, Harrell FE Jr, Moons KGM, Collins GS. Minimum sample size for developing a multivariable prediction model: Part I – Continuous outcomes. Stat Med. 2019;38(7):1262-1275. https://pubmed.ncbi.nlm.nih.gov/30347470/
- Liem Y, Judge A, Kirwan J, Ourradi K, Li Y, Sharif M. Multivariable logistic and linear regression models for identification of clinically useful biomarkers for osteoarthritis. Sci Rep. 2020;10(1):11328. https://pubmed.ncbi.nlm.nih.gov/32647218/
- Zhang YY, Zhou XB, Wang QZ, Zhu XY. Quality of reporting of multivariable logistic regression models in Chinese clinical medical journals. Medicine (Baltimore). 2017;96(21):e6972. https://pubmed.ncbi.nlm.nih.gov/28538397/
- Fernandez GA, Vatcheva KP. A comparison of statistical methods for modeling count data with an application to hospital length of stay. BMC Med Res Methodol. 2022;22(1):211. https://pubmed.ncbi.nlm.nih.gov/35927612/
- Uesaka K, Boku N, Fukutomi A, Okamura Y, Konishi M, et al. Adjuvant chemotherapy of S-1 versus gemcitabine for resected pancreatic cancer: a phase 3, open-label, randomised, non-inferiority trial (JASPAC 01). Lancet. 2016;388(10041):248-257. https://pubmed.ncbi.nlm.nih.gov/27265347/