Did you know that in a recent study, 55.3% of nodules (small growths) were found to be cancerous? This fact highlights the challenge of getting medical tests right. Healthcare workers aim to balance the accuracy of their tools. But often, the effects of testing thresholds can greatly change these important measurements.
Threshold effects are key in how well medical tests can diagnose a condition. They sway how we see test results. This can really change the balance between spotting a problem accurately and avoiding false alarms. To be wise in medical practice and when reviewing diagnostic tests, it’s key to know about these effects.
| Concept | Description | Impact on Diagnostic Accuracy | Accounting for Threshold Effects | Example |
|---|---|---|---|---|
| Threshold Effect 🎚️ | The relationship between sensitivity and specificity varies depending on the chosen cut-off value for a diagnostic test. | Can lead to an overestimation or underestimation of diagnostic accuracy if not accounted for. | Use methods that do not rely on a single cut-off value, such as ROC analysis or the Youden index. | In a test for diabetes, using a higher fasting blood sugar cut-off value will result in lower sensitivity but higher specificity. |
| Receiver Operating Characteristic (ROC) Curve 📈 | A graphical plot that illustrates the diagnostic ability of a binary classifier system as its discrimination threshold is varied. | Provides a comprehensive evaluation of diagnostic accuracy across all possible cut-off values. | Analyze the area under the ROC curve (AUC) to assess overall diagnostic accuracy, independent of a specific threshold. | ROC curves are commonly used in medical research to evaluate the performance of diagnostic tests, such as mammography for breast cancer detection. |
| Area Under the Curve (AUC) 🔍 | A measure of the overall diagnostic accuracy of a test, ranging from 0.5 (no discriminatory ability) to 1.0 (perfect discrimination). | Summarizes the diagnostic accuracy across all possible cut-off values, making it less sensitive to threshold effects. | Report AUC along with sensitivity and specificity to provide a more comprehensive assessment of diagnostic accuracy. | An AUC of 0.8 indicates that a randomly selected individual from the diseased group has a test value larger than that of a randomly chosen individual from the non-diseased group 80% of the time. |
| Youden Index 🎯 | The cut-off point that maximizes the sum of sensitivity and specificity minus one. | Provides an optimal cut-off value that balances sensitivity and specificity, reducing the impact of threshold effects. | Calculate the Youden index to determine the optimal cut-off value for a diagnostic test. | In a study evaluating a new biomarker for cancer detection, the Youden index can help determine the best cut-off value to maximize both sensitivity and specificity. |
| Likelihood Ratios 🧮 | The ratio of the probability of a test result in patients with the disease to the probability of the same test result in patients without the disease. | Less affected by threshold effects compared to sensitivity and specificity, as they are calculated using both sensitivity and specificity. | Report likelihood ratios (positive and negative) in addition to sensitivity and specificity to provide a more stable measure of diagnostic accuracy. | A positive likelihood ratio of 5 means that a positive test result is 5 times more likely to occur in patients with the disease than in those without the disease. |
| Fun Fact | The ROC curve is named after its origins in World War II, where it was used to analyze radar signals to differentiate between enemy and friendly aircraft. 🛩️ |
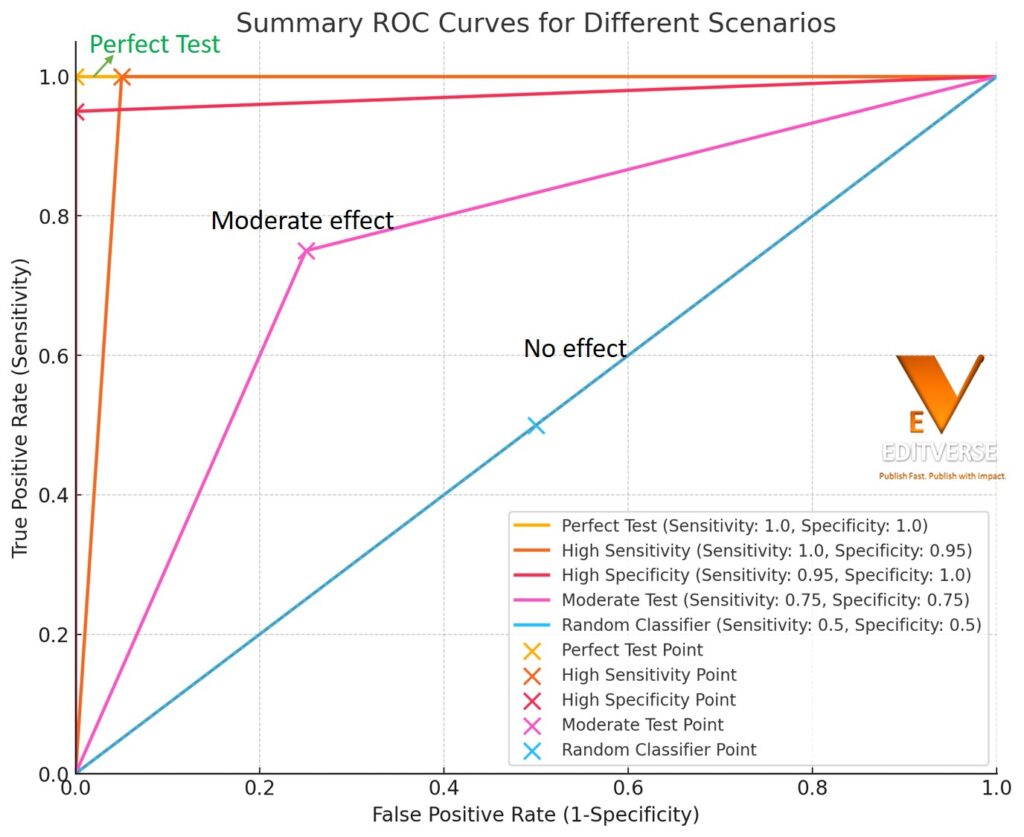
- Perfect Test: Sensitivity 100%, Specificity 100%
- High Sensitivity: Sensitivity 100%, Specificity 95%
- High Specificity: Sensitivity 95%, Specificity 100%
- Moderate Test: Sensitivity 75%, Specificity 75%
- Random Classifier: Sensitivity 50%, Specificity 50%
Each scenario’s key point is highlighted on the graph.
Recent studies have started to understand how complex it is to judge the accuracy of tests. Looking at research up to September 2012, it’s clear there’s a big mix in how tests are judged. This shows we need better, agreed ways to handle these threshold effects in our analysis.
As you dig into this area, you’ll see how thresholds affect the light in which you see test results. You’ll also learn about tools that can combine data from many sources. With these skills, the tricky world of how well tests pick up problems will become clearer. And you can make smarter choices in your work.
Key Takeaways
- Threshold effects significantly influence diagnostic accuracy in medical tests
- Balancing sensitivity and specificity is crucial for accurate diagnoses
- Meta-analyses of diagnostic test accuracy studies show wide variability in assessment approaches
- Understanding threshold effects is essential for interpreting test results correctly
- Advanced statistical techniques can help account for threshold effects in data synthesis
- Standardized methods are needed to improve the analysis of diagnostic accuracy across studies
Understanding Diagnostic Accuracy in Medical Tests
Diagnostic accuracy in medical tests is crucial. It guides doctors in making the best choices for patient care and treatment. We’ll look at how key factors influence how tests are understood.
Sensitivity and Specificity Explained
Sensitivity and specificity are key to understanding a test’s results. Sensitivity shows how well a test finds people with a disease. Specificity shows how well a test rules out disease in healthy people. These measurements are vital for testing trustworthiness.
| Measure | Definition | Formula |
|---|---|---|
| Sensitivity | Ability to identify patients with disease | True Positives / (True Positives + False Negatives) |
| Specificity | Ability to identify patients without disease | True Negatives / (True Negatives + False Positives) |
The Role of Thresholds in Test Interpretation
Thresholds are very important. They decide how sensitive or specific a test is. Changing the threshold changes the test’s accuracy. For example, the thresholds for diagnosing certain heart events can vary a lot. This can make a big difference in how we see test results.
Importance of Accurate Diagnosis in Clinical Practice
Getting the diagnosis right is key for quality care and treatment decisions. It ensures the proper choice of treatments and avoids doing too much. Sadly, many studies in this area have had problems. This shows we must be very careful when looking at how accurate tests are in real-life cases.
Research found that when each step of studies is well done, the results are clearer.
Knowing about diagnostic accuracy, sensitivity, specificity, and how thresholds work helps healthcare workers. It aids in understanding test results. This knowledge is crucial for making the best decisions for patients.
Threshold Effects: Definition and Significance
Threshold effects are very important in determining how accurate a diagnostic test is. They show up when sensitivity and specificity change from study to study. This happens because different studies use various cutoff points to decide if a test result is positive. Knowing about threshold effects helps us understand how well a test works and deal with different results we get from studies.
In medical tests, the point where a test result is seen as positive can be clear or not clear. Clear points are based on set values from lab tests. Not clear points can happen when doctors read imaging tests differently. These different ways can really change how accurate a test is.
Sensitivity and specificity often move in opposite directions because of threshold effects. If we increase the point at which a test is seen as positive, sensitivity goes down but specificity goes up. It’s key to keep this in mind when checking how well a test does in different studies.
- Higher thresholds: Lower sensitivity, higher specificity
- Lower thresholds: Higher sensitivity, lower specificity
Threshold effects explain why results from meta-analyses of diagnostic tests can differ so much. By looking at these effects, researchers can combine and make sense of data from several studies. This leads to better understandings of how a test performs overall.
Knowing about threshold effects is crucial for doctors and other health pros. It helps in making smarter choices when using or reading diagnostic tests. And in the end, it can make a big difference in how well patients are treated.
The Relationship Between Sensitivity and Specificity
Sensitivity and specificity are key in medical testing. Sensitivity finds true positives; specificity finds true negatives. They help us understand test performance trade-offs.
The Concept of Trade-offs in Test Performance
It’s important to balance sensitivity and specificity. When one goes up, the other might go down. These changes can affect how accurate a test is. For example, a highly sensitive eye test might find more cases but might also show false positives.
| Measure | Definition | Impact |
|---|---|---|
| Sensitivity | True positive rate | Fewer missed cases |
| Specificity | True negative rate | Fewer false alarms |
| PPV | Positive Predictive Value | Accuracy of positive results |
| NPV | Negative Predictive Value | Accuracy of negative results |
Visualizing the Relationship: ROC Curves
ROC curves are a way to see sensitivity and specificity’s relationship. They show true positive and false positive rates at different points. ROC curves help pick the best cut-off points for diagnosis.
Test performance changes in real situations. In studies on oral surgery, sensitivities were between 75% and 100%, and specificities were between 72% and 100%. This shows we need to consider the unique aspects of each test in different medical settings.
Variability in Test Performance Across Studies
Test performance can vary a lot in diagnostic tests. Different study groups and ways of testing all play a part. It’s important to understand these differences. This helps make sense of results and draw the right conclusions.
When looking at how researchers handle these variations, here’s what was found:
- 91% of meta-analyses used visual representations like forest plots or ROC curves
- 75% included statistical measures for variability
- 53% applied Cochran’s Q test to assess variability beyond chance
- 58% quantified variability using I2
- 13% presented between-study variance estimates from random effects models
These findings show the significance of dealing with variability in diagnostic studies. Researchers use different statistical tools to manage this variability. This makes their meta-analyses more trustworthy and helpful.
| Measure | Percentage of Meta-analyses |
|---|---|
| Visual representation | 91% |
| Statistical measures | 75% |
| Cochran’s Q test | 53% |
| I2 quantification | 58% |
| Between-study variance estimates | 13% |
Understanding and dealing with variation in test performance is key. It’s crucial for making medical research meta-analyses more reliable. By overcoming these challenges, the results become more valid for clinical use.
Challenges in Meta-Analysis of Diagnostic Test Accuracy
Meta-analysis faces unique hurdles for researchers. These obstacles come from the complex nature of diagnostic data and its analysis methods.
Heterogeneity in Study Results
Dealing with study differences is a big issue in meta-analysis. Various factors like patient groups and testing methods cause this. This makes drawing universal conclusions about a test’s quality tricky.
Correlated Sensitivity and Specificity
Sensitivity and specificity often move together in analysis. If one goes up, the other may go down. This makes using traditional analysis methods hard.
The Multivariate Nature of the Problem
Meta-analysis needs to handle multiple outcomes at once. Sensitivity and specificity are two outcomes that must be looked at together. Because of this, special stats methods are needed for the job.
Researchers are using new statistical methods to tackle these issues. Tools like bivariate models and HSROC curves help. They address the problems of connected outcomes and study differences well.
| Challenge | Impact | Solution |
|---|---|---|
| Heterogeneity | Inconsistent results across studies | Use of random-effects models |
| Correlated Outcomes | Biased estimates if ignored | Bivariate analysis methods |
| Multivariate Nature | Complex data structure | Specialized statistical approaches |
By overcoming these hurdles, experts can do better meta-analyses. This means more trustworthy insights for medical choices. It ultimately improves care for patients.
Diagnostic Accuracy and How to Account for Them in Analysis
To study diagnostic accuracy well, you need certain statistics. These help deal with how well a test identifies a condition. They also help combine findings from many tests to make stronger conclusions about how a test works. They look at the test’s results in various situations.
When looking at diagnostic accuracy, two methods stand out: summary points and summary lines. Summary points are best when different studies all show the same test accuracy. Summary lines fit better when these researches don’t agree on the test’s results.
Today, advanced stats like multivariate models are key. They include tools like the bivariate model and the HSROC model. These tools talk about how studies might be connected in their findings. This gets us closer to the actual performance of a test.
Recent studies show why these methods are crucial. An analysis on MRI to find out about silicone ruptures found some design issues that can mess with the results. Another research on deep learning to spot lung nodules showed how important these analytic tools are when we try new diagnostic tech.
| Analysis Method | Best Used For | Key Feature |
|---|---|---|
| Summary Points | Similar sensitivity/specificity | Single point estimate |
| Summary Lines | Varying sensitivity/specificity | Range of estimates |
| Bivariate Model | Correlated data | Accounts for between-study variation |
Statistical Approaches to Synthesizing Test Performance Data
Researchers use different ways to combine test performance data. By doing this, they can get a full picture of how well a test works. This is important for understanding if the test is accurate or not.
Summary Point Method
This method gives you one set of sensitivity and specificity values. It’s good when the numbers from different studies are pretty similar. In a quick look, you see how well the test is likely to do.
Summary Line Method
When numbers like sensitivity and specificity are very different, there’s another way. The Moses-Littenberg SROC curve helps here. It lets you see how well the test balances both sensitivity and specificity, letting you make better comparisons.
Bivariate Random Effects Models
If we’re talking about meta-analysis in diagnostic accuracy studies, some models are better. The Reitsma et al. model is one. It’s good because it understands how sensitivity and specificity relate to each other, making the results more meaningful.
| Method | Best Use Case | Key Feature |
|---|---|---|
| Summary Point | Low variability across studies | Single pair of sensitivity and specificity |
| Summary Line | High variability across studies | Visualizes trade-off between sensitivity and specificity |
| Bivariate Random Effects | Most diagnostic accuracy studies | Accounts for correlation between sensitivity and specificity |
Picking the right statistical method is key for getting reliable test data. Each way has its own benefits. Choose the one that fits best with what information you have and what you want to find out.
Choosing Between Summary Point and Summary Line Approaches
In a diagnostic accuracy meta-analysis, a key choice is between summary point and summary line approaches. This decision greatly affects your study’s outcome. For situations where test performance is consistent, the summary point method works well.
Yet, if test performance varies a lot, the summary line method is preferable. It shows the balance between sensitivity and specificity. Recent data reveals that a big part of the Cochrane Database reviews focus on such analyses. This points to the importance of making informed choices.
When making your decision, think about your study’s context. For example, if you’re trying to reduce knee radiograph use and cut healthcare spending, the summary line could be more suitable. It helps address test variability in different healthcare settings. Keep in mind, using both methods when appropriate can lead to the most thorough analysis.

FAQ
What are sensitivity and specificity in diagnostic tests?
Sensitivity and specificity show how well tests can spot if someone has a condition. Sensitivity is about catching people with the condition right (true positive). Specificity is about not mistaking people without the condition for having it (true negative).
Why are thresholds important in test interpretation?
How we set thresholds affects how good a test is at finding true positives and true negatives. Changing where we set the threshold in a test can make it better or worse at catching certain conditions.
What are threshold effects in diagnostic accuracy studies?
Threshold effects happen when changing the test’s cutoff point impacts how well it finds or rules out conditions. This explains why study results can differ and why diagnostic accuracy reviews have to be careful.
How are sensitivity and specificity related?
Sensitivity and specificity often change together, known as the “threshold effect.” If you make a test better at finding true positives, it might get worse at finding true negatives, and the other way around. This relationship is shown by ROC curves.
Why is variability in test performance a challenge in meta-analyses?
Tests can perform differently in various studies due to many factors. These include who is being tested, the standard they are compared to, the test itself, how the study is done, and the positive result level. Understanding and explaining these differences is crucial when combining study results.
What are the unique challenges in meta-analysis of diagnostic test accuracy?
Meta-analyses face problems like mixed results, intertwined sensitivity and specificity, and many changing parts. Solving these problems requires special statistics to properly combine test accuracy data.
How can threshold effects be accounted for in diagnostic accuracy analysis?
The bivariate or HSROC models help by looking at how thresholds change sensitivity and specificity. They are good when these two measures work together. For studies with similar results, using summary points is a good idea. For others, like those with different results, using summary lines can be better.
What are some statistical approaches for synthesizing test performance data?
To combine test results, we can use the summary point method for similar studies or the summary line method if studies are more varied. Another option is the bivariate model to understand the relation between sensitivity and specificity well.
How do you choose between summary point and summary line approaches?
Choose between summary points and lines based on how alike are the studies’ sensitivity and specificity findings. If the results are close, summary points work well. If they differ a lot, summary lines are better. The choice should also think about what the meta-analysis is for.
Source Links
- https://www.ncbi.nlm.nih.gov/pmc/articles/PMC10140638/ – How to Critically Appraise and Interpret Systematic Reviews and Meta-Analyses of Diagnostic Accuracy: A User Guide
- https://www.ncbi.nlm.nih.gov/books/NBK578679/ – Diagnostic accuracy systematic review and meta-analysis – Dynamic contrast-enhanced CT compared with positron emission tomography CT to characterise solitary pulmonary nodules: the SPUtNIk diagnostic accuracy study and economic modelling
- https://www.e-epih.org/journal/view.php?doi=10.4178/epih.e2022083 – Meta-analysis of diagnostic test accuracy studies with multiple thresholds for data integration
- https://www.cmaj.ca/content/174/4/469 – Evidence of bias and variation in diagnostic accuracy studies
- https://bmjopen.bmj.com/content/6/11/e012799 – STARD 2015 guidelines for reporting diagnostic accuracy studies: explanation and elaboration
- https://www.ncbi.nlm.nih.gov/books/NBK557491/ – Diagnostic Testing Accuracy: Sensitivity, Specificity, Predictive Values and Likelihood Ratios – StatPearls
- https://www.ncbi.nlm.nih.gov/pmc/articles/PMC4975285/ – Measures of Diagnostic Accuracy: Basic Definitions
- https://effectivehealthcare.ahrq.gov/products/methods-guidance-tests-metaanalysis/methods – Chapter 8: Meta-Analysis of Test Performance When There Is a “Gold Standard”
- https://www.ncbi.nlm.nih.gov/pmc/articles/PMC6856843/ – Quantifying how diagnostic test accuracy depends on threshold in a meta‐analysis
- https://www.sciencedirect.com/topics/medicine-and-dentistry/sensitivity-and-specificity – Sensitivity and Specificity – an overview
- https://www.health.ny.gov/diseases/chronic/discreen.htm – Disease Screening – Statistics Teaching Tools
- https://www.ncbi.nlm.nih.gov/pmc/articles/PMC4714528/ – Assessing variability in results in systematic reviews of diagnostic studies
- https://www.ncbi.nlm.nih.gov/pmc/articles/PMC1373751/ – Evidence of bias and variation in diagnostic accuracy studies
- https://mentalhealth.bmj.com/content/18/4/103 – Meta-analysis of diagnostic accuracy studies in mental health
- https://www.ncbi.nlm.nih.gov/pmc/articles/PMC4644738/ – Systematic Review and Meta-Analysis of Studies Evaluating Diagnostic Test Accuracy: A Practical Review for Clinical Researchers-Part I. General Guidance and Tips
- https://www.nature.com/articles/bjc2013185 – A step-by-step guide to the systematic review and meta-analysis of diagnostic and prognostic test accuracy evaluations – British Journal of Cancer
- https://www.ncbi.nlm.nih.gov/pmc/articles/PMC10425262/ – Meta-analysis of Diagnostic Test Accuracy Assessment Studies with Varying Number of Thresholds
- https://www.ncbi.nlm.nih.gov/pmc/articles/PMC8440098/ – Diagnostic Accuracy Studies in Radiology: How to Recognize and Address Potential Sources of Bias
- https://nursing.lsuhsc.edu/JBI/docs/JBIBooks/Diagnostic Accuracy.pdf – LWBK991-Book6-FM.tex
- https://www.ncbi.nlm.nih.gov/pmc/articles/PMC8246725/ – Reporting of test comparisons in diagnostic accuracy studies: A literature review
- https://www.goodreports.org/reporting-checklists/stard/info/ – EQUATOR guidelines
- https://methods.cochrane.org/sites/methods.cochrane.org.sdt/files/uploads/Chapter 10 – Version 1.0.pdf – Microsoft Word – Chapter 10 – 9Dec2010 _2_ JD_22Dec
- https://pubs.rsna.org/doi/full/10.1148/radiol.221437 – How to Critically Appraise and Interpret Systematic Reviews and Meta-Analyses of Diagnostic Accuracy: A User Guide | Radiology