Published | Last updated
The Donabedian model evaluates healthcare quality through three linked dimensions: Structure (physical resources, staffing, technology), Process (clinical and administrative actions taken during care), and Outcomes (measurable effects on patient health). Introduced by Avedis Donabedian in 1966 and refined in 1988, it is the foundational framework for clinical quality assessment, accreditation standards, and health systems research worldwide.
Healthcare quality is difficult to define, yet consequential to measure. A hospital with modern imaging equipment may still harm patients if its care processes are inconsistent. A well-staffed clinic with excellent clinical protocols may still report poor outcomes if its patient population faces severe social determinants of health. The Donabedian model accounts for this complexity by separating quality into three causally linked domains — each of which must be assessed independently and together.
This guide explains each domain, shows how to operationalise them in 2026 contexts including telemedicine and AI-assisted care, and provides practical templates for quality improvement projects and manuscript methods sections. It also works through a published study, re-analysed in R, that compares two models of HIV care domain by domain.
What Is the Donabedian Model?
Avedis Donabedian, a physician born in Beirut to an Armenian family who built his career at the University of Michigan School of Public Health,5 introduced his quality framework in 1966 in the Milbank Memorial Fund Quarterly.1 His argument was direct: outcomes alone cannot measure care quality because outcomes are influenced by patient characteristics no clinician controls. Structure and process are the levers a healthcare organisation can actually change.
In 1988, Donabedian expanded the framework in JAMA, providing operational definitions for each domain and establishing the causal chain explicitly: good structure enables good processes; good processes increase the probability of good outcomes.2 This is a probabilistic, not deterministic, relationship — a crucial distinction for researchers designing quality improvement studies or writing methods sections.
The Three Domains: Comparison Table
| Domain | What It Measures | Example Indicators | Data Sources |
|---|---|---|---|
| Structure | Attributes of the care setting — facilities, equipment, staffing, organisational policies | Nurse-to-patient ratio; CT availability; accreditation status; EHR interoperability | Administrative databases; facility surveys; HR records |
| Process | What is done to and for patients — clinical actions, care coordination, patient education | Guideline adherence rate; hand-hygiene compliance; time-to-thrombolysis; medication reconciliation | Electronic health records; clinical audit data; direct observation |
| Outcomes | Effects of care on patient health status and experience | 30-day readmission; PROMs; mortality rate; complication rate; patient satisfaction score | Clinical registries; patient surveys; death records; claims data |

Structure — The Foundation of Care Delivery
Structure describes the stable characteristics of the setting in which care occurs. Donabedian organised structural elements into three categories: material resources (facilities, equipment, finances), human resources (staffing numbers and qualifications), and organisational structure (peer review systems, reimbursement arrangements, accreditation status).
Structure is the easiest Donabedian domain to measure — it can be audited from administrative records — but it has the weakest direct link to outcomes. A hospital can possess every piece of advanced equipment and still deliver poor care if its processes are inconsistent. Structure sets a ceiling on possible quality; it does not guarantee it.
When writing a methods section for a quality assessment study, justify why you chose specific structural indicators. Regulatory bodies (Joint Commission, Care Quality Commission, NABH) use structural standards as a proxy for quality because they are verifiable and comparable across sites — not because structure directly causes good outcomes.
Structural Indicators in 2026
The scope of structural assessment has expanded significantly. In 2026, relevant structural elements include: telemedicine platform interoperability with the EHR, availability and validation status of AI-assisted diagnostic tools, cybersecurity posture for patient data protection, and digital health literacy support resources for patients. Any quality assessment that omits these elements is using a 2010-era structural framework for a 2026 healthcare environment.
Process — What Clinicians Actually Do
Process measures capture the activities that constitute care delivery. They are more sensitive indicators of quality than structural measures because they reflect what clinicians do rather than what they have access to. Adherence to evidence-based guidelines, medication reconciliation at discharge, surgical checklist completion, and informed-consent documentation are all process measures.
Process measures are favoured in quality improvement because they are modifiable. A staffing ratio is hard to change quickly; a care protocol is not. Most clinical quality dashboards are accordingly dominated by process indicators: hand-hygiene rates, door-to-balloon times, sepsis bundle compliance, pressure injury prevention bundle adherence.
Linking Process to Outcomes
The Donabedian model assumes good processes increase the probability of good outcomes — it does not assume they guarantee them. A patient receiving timely thrombolysis (good process) may still die of a massive stroke (poor outcome) due to pre-existing comorbidities. This is why process and outcome measures must be reported together in quality research, and why outcomes should always be risk-adjusted before being attributed to care processes.
Outcomes — The Ultimate Test
Outcomes measure the changes in health status attributable to care. Donabedian included not only clinical outcomes (mortality, complications, functional status) but also patient-reported outcomes and satisfaction scores. He emphasised that outcomes reflect contributions from many factors, not care alone — which is why risk adjustment is essential before comparing outcome rates across institutions or time periods.
Modern outcome measurement in 2026 spans five categories:
- Clinical outcomes: mortality, readmission rates, complication rates, length of stay
- Patient-reported outcome measures (PROMs): disease-specific and generic health-related quality of life instruments (EQ-5D, SF-36, PROMIS)
- Patient experience measures: HCAHPS, Press Ganey scores, NHS Friends and Family Test
- Population-level indicators: disease-specific mortality rates, preventable hospitalisation rates, vaccination coverage
- Value outcomes: cost per quality-adjusted life-year (QALY) in value-based care contracts and health technology assessment submissions
How to Apply the Donabedian Model in Practice
The framework is used in three principal contexts: quality improvement projects, accreditation and regulatory compliance, and research methods design.
Quality Improvement Projects
A Donabedian-structured quality improvement project follows this sequence:
- Define the outcome problem — specify the outcome you want to improve (e.g., 30-day surgical site infection rate)
- Audit process adherence — measure compliance with the relevant care bundles (pre-operative skin preparation, antibiotic prophylaxis timing, dressing change protocols)
- Assess structural deficits — evaluate availability of appropriate antiseptics, staff training completion rates, laminar-flow theatre access
- Design targeted interventions — address both process (introduce a surgical checklist) and structure (procure compliant antiseptic agents, schedule staff training)
- Measure outcome change — track infection rates at 3, 6, and 12 months post-intervention, with risk adjustment for case mix
Accreditation and Regulatory Compliance
Major accreditation bodies structure their standards around all three Donabedian domains. Structural standards (facility requirements, staff credentials, equipment certifications) are assessed at initial accreditation. Process standards (care protocols, documentation completeness, patient safety event reporting) are assessed on ongoing surveys and tracer methodology. Outcome standards (patient safety event rates, infection rates, mortality benchmarks) are monitored through mandatory reporting requirements and compared against national benchmarks.
Research Methods
In published quality research, the Donabedian framework appears primarily in the conceptual or theoretical framework subsection of the methods. Researchers pre-specify which structural, process, and outcome indicators they will measure, justify their selection with reference to existing evidence, and describe how they will attribute changes in outcomes to changes in structure or process. A common methodological error is conflating domain types — for example, classifying a care coordination protocol (process) as an organisational resource (structure). Clear domain assignment is required for the framework to function as intended.
Donabedian Model Example With Real Data: Clinic vs Community HIV Care
A published study shows how the three domains work together, and why reading only one of them misleads. Okere and colleagues used the Donabedian framework to compare two ways of delivering antiretroviral therapy (ART) in northwest Tanzania: the usual HIV clinic, and community ART clubs of 15 to 30 stable clients run by community health workers.4 They surveyed 629 clients (378 in clinics, 251 in clubs) and 24 health workers, reviewed client folders, and sorted every indicator into structure, process or outcome. The article is open access under a CC BY 4.0 licence, so we took the counts from its Tables 3 to 5 and re-ran the comparisons in R.
Table 2. Selected indicators from Okere et al., one row per Donabedian domain item (clinic n = 378, club n = 251).4
| Domain | Indicator | Clinic % | Club % | Club minus clinic (95% CI) |
|---|---|---|---|---|
| Structure | Health worker reachable by phone | 42.9 | 62.9 | +20.1 (12.2 to 27.6) |
| Structure | Regular, convenient ARV supply | 73.0 | 71.3 | −1.7 (−8.9 to 5.3) |
| Process | Screened for opportunistic infections and TB | 85.4 | 78.5 | −7.0 (−13.3 to −0.9) |
| Process | ARV dispensed at every recent visit | 97.9 | 94.0 | −3.9 (−7.7 to −0.8) |
| Process | Adherence assessed | 91.0 | 94.0 | +3.0 (−1.4 to 7.1) |
| Process | Median time per visit, minutes | 119.9 | 49.9 | 70 minutes shorter in clubs |
| Outcome | Retained (attended last 3 visits) | 97.6 | 100 | +2.4 (0.5 to 4.5) |
| Outcome | Viral load below 50 copies/mL | 99.2 | 94.4 | −4.8 (−8.4 to −2.1) |

What the re-analysis shows
Structure was almost identical. Clubs matched clinics on five of six structure items. The one clear gap favoured clubs: clients could reach their health worker by phone far more often (62.9% vs 42.9%).
Process traded speed for completeness. A club visit took a median 49.9 minutes against 119.9 in the clinic, but clubs documented screening for opportunistic infections and TB less often (78.5% vs 85.4%) and dispensed ARVs at every recent visit slightly less often.
The two outcomes point in opposite directions. Every club member attended the last three meetings, against 97.6% of clinic clients, yet viral suppression was lower in clubs (94.4% vs 99.2%). A study that reported only retention would call the clubs better; one that reported only viral load would call them worse. Read with structure and process, the picture is a faster, more accessible model that needs tighter screening and monitoring.
Case mix is not equal. Club clients were older (mean 46.0 vs 41.0 years) and had been on ART longer (median 4.27 vs 3.45 years), and only stable clients could join a club.4 The outcome gaps therefore describe the two groups, not the effect of the club model. This is the risk-adjustment point from the outcomes section above, in real numbers.
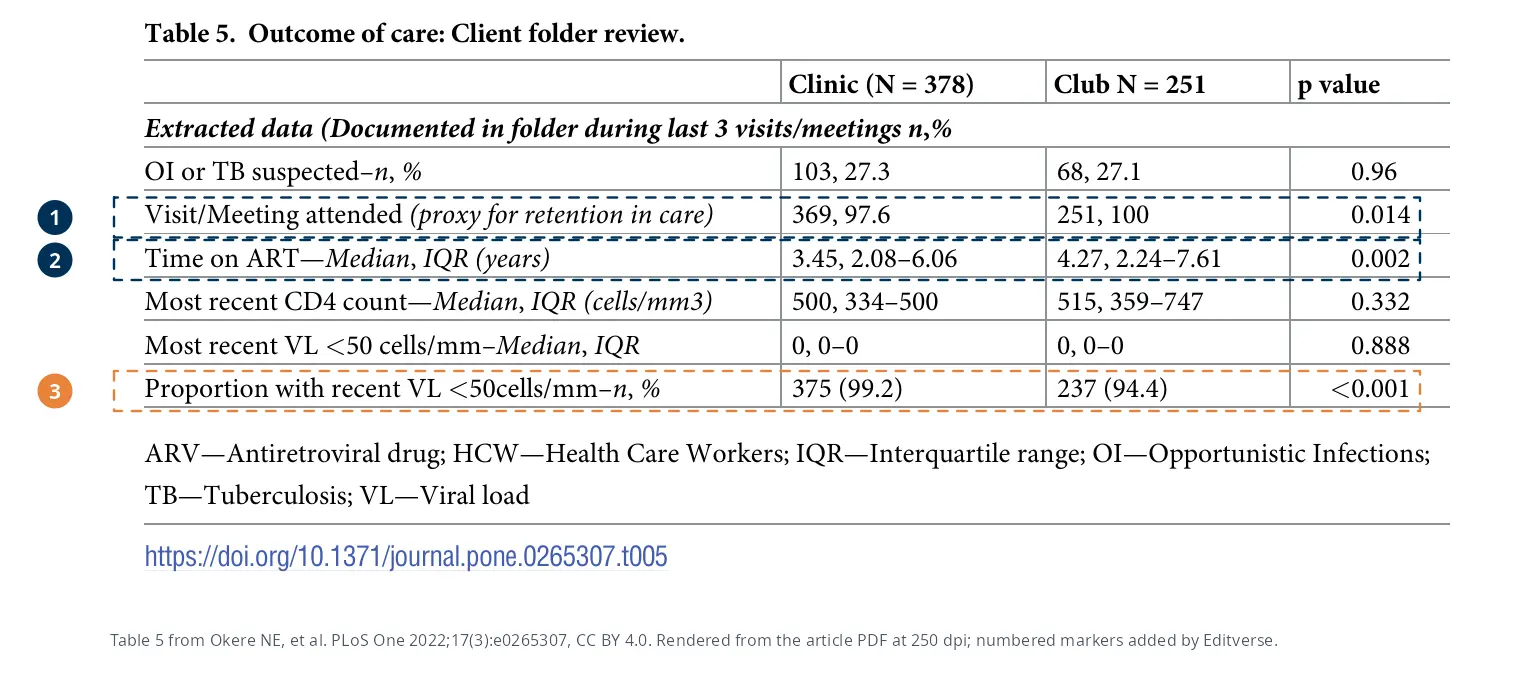
What the markers in Figure 3 show.
- 1Retention is a proxy. It is attendance at the last three visits or meetings (369 of 378 vs 251 of 251). The authors chose it because the clubs were less than a year old, too early for one-year retention.
- 2The groups differ at baseline. Time on ART is longer in clubs (p = 0.002). A baseline difference like this is a case-mix signal: adjust for it before attributing outcomes to the model of care.
- 3Cite the table, not the abstract. Clinic viral suppression is 375 of 378, or 99.2%. The abstract rounds it to 100%.
How we checked the numbers
A Pearson chi-square test without continuity correction reproduces the published p-values for 12 of the 14 client indicators. For “private meeting space” the table prints 185 club clients, but its 74.1% and p = 0.554 both match 186, so 186 is the count we used. Where a group has fewer than five expected events (respectful service, recent viral load test, and the health-worker venue item with only 24 respondents), Fisher’s exact test is the safer choice: for the venue item, chi-square gives p = 0.011 and Fisher’s test p = 0.035.
# Retention, Table 5: attended last 3 visits (yes, no)
m <- matrix(c(251, 0, 369, 9), nrow = 2,
            dimnames = list(c("yes", "no"), c("club", "clinic")))
chisq.test(m, correct = FALSE)$p.value  # 0.014, as published
fisher.test(m)$p.value                  # 0.013
Methods template for your own study
“Quality of care was assessed with Donabedian’s structure–process–outcome framework. Structure indicators were [staffing, supplies, space]; process indicators were [screening, dispensing, adherence assessment, visit time]; outcome indicators were [retention, viral suppression]. Each indicator is reported as n/N with the between-group difference and its 95% confidence interval. Groups were compared with the chi-square test, or Fisher’s exact test when an expected count was below five, and outcome comparisons were adjusted for [age, time on treatment].”
Donabedian Model in 2026: New Dimensions
The Donabedian framework has been extended in the literature to telehealth, AI-assisted diagnostics, and value-based care contracts. Each introduces new structural and process variables that traditional quality assessment checklists did not capture.
Telemedicine and Virtual Care
Structural indicators for telemedicine include: EHR-integrated platform availability, patient digital access and device literacy, and clinician certification in virtual clinical assessment. Process indicators include: whether structured virtual follow-up was scheduled within an appropriate timeframe, medication reconciliation completion during the virtual encounter, and adherence to tele-triage clinical decision protocols. Outcome indicators remain the same as for in-person care — but require additional risk adjustment because telehealth populations are not randomly selected from the broader patient population.
AI-Assisted Care
AI diagnostic tools are structural elements — like a CT scanner, they either exist and are validated, or they do not. Their use in a specific clinical encounter is a process variable: was the AI-generated risk score reviewed and acted upon by the responsible clinician, and was this documented? Patient outcomes downstream of AI-assisted decisions are outcome variables, and attribution requires rigorous study design rather than simple before-after comparison.
Value-Based Care
Value-based care contracts (bundled payments, accountable care organisations) reweight the Donabedian domains in practical terms: structural compliance receives less regulatory attention; process adherence is incentivised through shared-savings arrangements; outcomes — particularly patient-reported outcomes, total cost of care, and QALY estimates — become the primary contract performance metrics. Quality improvement teams in value-based environments should weight their indicator sets accordingly.
Limitations of the Donabedian Model
| Limitation | Practical Implication |
|---|---|
| Assumes a linear causal chain (Structure → Process → Outcome) | Healthcare systems involve feedback loops and bidirectional relationships. Combine Donabedian with systems-thinking frameworks for complex interventions. |
| Outcome attribution is confounded by patient-level factors | Always risk-adjust outcome indicators. Raw outcome rates are not comparable across institutions without case-mix adjustment. |
| Does not explicitly include social determinants of health | Supplement with social determinants data (housing, income, health literacy) when outcomes are heavily driven by factors outside the healthcare system. |
| Process measures can be gamed (Goodhart’s Law) | Diversify your indicator set. No single process measure should carry disproportionate weight in a financial incentive scheme. |
Planning a Quality-of-Care Study? Consult Editverse
Editverse subject-matter experts work to COPE, ICMJE and GPP 2022 guidance, with institutional and country-specific ethics followed. Choose the stage you are at.

Editverse
Study Design
Building a Donabedian study? Get your structure, process and outcome indicators right before data collection.
You send: your research question, setting and any draft protocol or indicator list.
You get: guidance on design selection, outcome selection and measurement, sample size and bias mitigation, so each indicator sits in the right domain.
When: standard turnaround is 3 to 5 business days.
Study Design Consultation · $400
Editverse
Statistical Analysis
Comparing sites or models of care? Have the differences, intervals and tests run properly.
You send: your data, research questions and preferred software (SPSS, R or STATA).
You get: annotated code or syntax, complete output files, an interpretation guide and publication-ready tables.
When: standard turnaround is 4 to 6 business days.
SPSS/R/STATA Statistical Analysis · $400
Editverse
Manuscript Writing
Results ready? Turn your quality-of-care findings into a journal-ready paper.
You send: your outline, data, figures, tables and key references, plus the target journal.
You get: a full manuscript written by a subject-matter expert, with statistical review, journal formatting, cover letter and revision support until acceptance.
When: standard delivery is 15 days; express delivery is available.
Manuscript Writing Services · $1,500
Free Research Tools from Editverse
- Statistical Test Selector: answer a few questions about your outcome and groups and get the right test, including chi-square versus Fisher’s exact test.
- Sample Size Calculator: power analysis for comparing two proportions, such as retention or guideline adherence between sites.
- StatPro: free calculators for group comparisons, categorical outcomes, time-to-event analysis and diagnostic accuracy.
Related Resources
- Medical Writing and Scientific Communication Services
- Clinical Research Documentation Services
- Systematic Review Writing Service (PRISMA 2020)
- PRISMA Flow Chart Steps: Complete Guide (2026)
- Free Statistical Test Selector
FAQ
What is the Donabedian model?
The Donabedian model is a conceptual framework for evaluating healthcare quality developed by Avedis Donabedian in 1966 and refined in 1988. It organises quality assessment around three domains: Structure (the resources and organisational characteristics of the care setting), Process (the clinical and administrative actions performed during care delivery), and Outcomes (the effects of care on patient health status). The framework provides a systematic method for identifying where quality failures originate and where improvement efforts should be directed.
What are the three components of the Donabedian model?
The three components are: (1) Structure — physical resources such as facilities and equipment, human resources including staffing numbers and qualifications, and organisational resources such as policies and accreditation status; (2) Process — the specific clinical and administrative actions taken during care, including guideline adherence, medication management, and patient communication; (3) Outcomes — the changes in patient health status resulting from care, including mortality, complications, patient-reported outcomes (PROMs), and satisfaction.
Why is the Donabedian model important for healthcare quality assessment?
The model prevents the common error of judging care quality purely by outcomes, which are influenced by patient characteristics outside any clinician’s control. By separating structure, process, and outcomes into distinct measurable domains, quality improvement teams can identify whether a problem originates in insufficient resources (a structural deficit), inconsistent clinical practice (a process failure), or case-mix factors affecting measured outcomes independently of care quality.
How is the Donabedian model used in research methods?
In published quality research, the Donabedian model typically appears in the conceptual or theoretical framework section. Researchers pre-specify which structural, process, and outcome indicators they will measure, justify each indicator’s selection with existing evidence, and describe how outcome changes will be attributed to process or structural changes. The framework also appears in the introduction to establish clinical significance — for instance, showing that a known structural or process gap explains a documented outcome problem in the study population.
What are the main limitations of the Donabedian model?
Four limitations receive the most attention. First, the model assumes a linear causal chain (Structure to Process to Outcome), while real healthcare systems involve feedback loops. Second, outcomes are confounded by patient-level and social factors unrelated to care quality, requiring risk adjustment before any attribution can be made. Third, the model does not explicitly include social determinants of health, which are often the primary drivers of population-level outcome differences. Fourth, process measures are susceptible to gaming (Goodhart’s Law) when tied to financial incentives.
How does the Donabedian model apply to telemedicine in 2026?
In telehealth contexts, structural indicators include EHR-integrated platform availability, patient digital access and device literacy, and clinician training in virtual clinical assessment. Process indicators include structured virtual follow-up scheduling, medication reconciliation during the telehealth encounter, and adherence to tele-triage decision protocols. Outcome indicators are identical to those for in-person care but require additional risk adjustment because telehealth populations are not randomly selected and typically differ in baseline health characteristics from patients seen in person.
What is an example of the Donabedian model in research?
Okere and colleagues (PLOS ONE, 2022) compared HIV clinics with community ART clubs in Tanzania using the framework. Structure covered staff, supplies and venue; process covered screening, dispensing, adherence checks and visit time; outcomes covered retention and viral suppression. Clubs had similar structure, much shorter visits and higher retention, but lower documented screening and lower viral suppression, and their clients were older and longer on treatment, which is why outcomes need risk adjustment.
How do you analyse structure, process and outcome indicators?
Report each indicator as a count over its denominator, compare groups as a difference in proportions with a 95% confidence interval, and test with chi-square, or Fisher’s exact test when any expected count is below five. Keep the three domains separate in tables and figures so readers can see where a gap arises, and adjust outcome comparisons for case mix such as age, severity or time on treatment.
References
- Donabedian A. Evaluating the Quality of Medical Care. Milbank Mem Fund Q. 1966;44(3 Suppl):166-206. doi:10.2307/3348969 PMID: 5338568. Reprinted in Milbank Q. 2005;83(4):691-729, free full text PMC2690293.
- Donabedian A. The quality of care: how can it be assessed? JAMA. 1988;260(12):1743-1748. doi:10.1001/jama.1988.03410120089033 PMID: 3045356
- Ayanian JZ, Markel H. Donabedian’s Lasting Framework for Health Care Quality. N Engl J Med. 2016;375(3):205-207. doi:10.1056/NEJMp1605101
- Okere NE, Meta J, Maokola W, Martelli G, van Praag E, Naniche D, et al. Quality of care in a differentiated HIV service delivery intervention in Tanzania: A mixed-methods study. PLoS One. 2022;17(3):e0265307. doi:10.1371/journal.pone.0265307 PMID: 35290989. Open access, CC BY 4.0.
- Frenk J. Avedis Donabedian [obituary]. Bull World Health Organ. 2000;78(12):1475. scielosp.org/article/bwho/2000.v78n12/1475-1475
Editverse Research Team | Updated October 2026