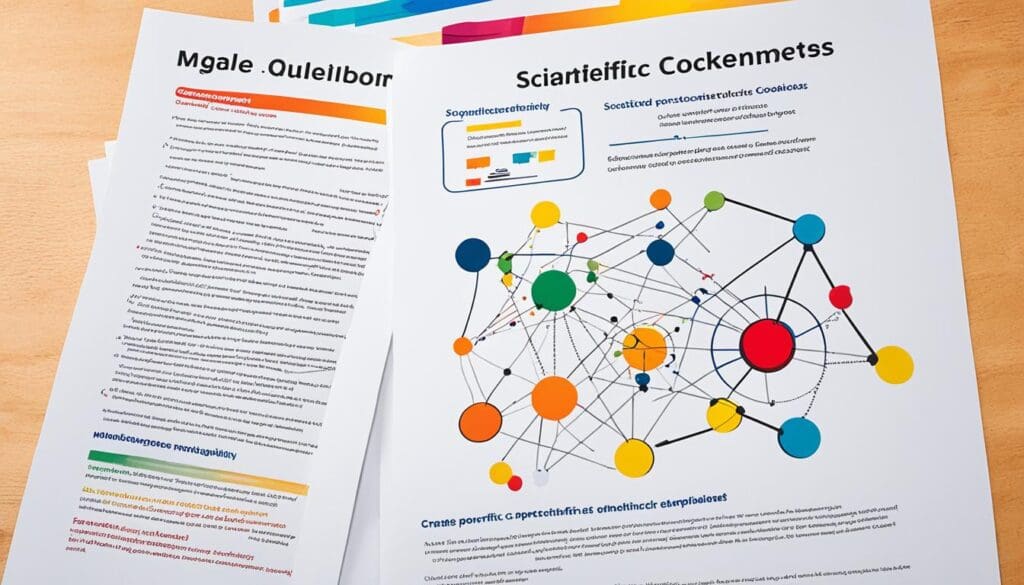
Creating graphical abstracts is an essential skill for researchers who want to effectively communicate their findings in academic journals. Graphical abstracts are visual representations of research papers that summarize the key findings and main concepts in a concise and engaging way. They play a vital role in scientific communication, helping readers quickly understand the main points of a study and decide whether to read the full paper.
Crafting Effective Graphical Abstracts
A Comprehensive Guide to Creating Impactful Visual Summaries for Academic Journals
Visit www.editverse.com or email su*****@*******se.com
Key Elements of an Effective Graphical Abstract
Clear Visual Hierarchy: Guide the viewer’s attention through your research story
Simple Design: Avoid cluttered layouts and complex details
Limited Text: Use minimal text, only for essential labels
Color Strategy: Use a consistent, professional color palette
High Resolution: Ensure all elements are clear and sharp
Recommended Tools
- Adobe Illustrator
- BioRender
- Canva Pro
- PowerPoint
- Inkscape
File Specifications
- Resolution: 300 DPI minimum
- Format: TIFF or PDF
- Dimensions: Journal-specific
- Color Mode: CMYK
- File Size: Usually < 10MB
Common Mistakes to Avoid
- Overcrowding information
- Using low-resolution images
- Complex scientific jargon
- Inconsistent styling
- Poor color contrast
Professional Tips
- Start with a clear sketch of your concept
- Follow journal-specific guidelines strictly
- Use consistent visual style throughout
- Test visibility at different sizes
- Get feedback from colleagues
Our Services
Professional Graphical Abstract Creation
- Expert designers with scientific background
- Journal-specific formatting
- Multiple revision rounds
- High-resolution deliverables
- Quick turnaround time
- Affordable pricing
Ready to Create Your Graphical Abstract?
Contact us for professional assistance and ensure your research makes a strong visual impact.
Email: su*****@*******se.com
Website: www.editverse.com
In this section, we will explore the importance of graphical abstracts in scientific communication and provide tips on how to create effective and visually compelling graphical abstracts for journals.

Key Takeaways:
- Graphical abstracts are visual representations of research papers that summarize the key findings and main concepts.
- They play a crucial role in scientific communication, helping readers quickly understand the main points of a study.
- Creating effective graphical abstracts requires understanding the concept and purpose of a graphical abstract, as well as design tips and selecting the right tools.
- Visualization techniques and scientific illustrations can enhance the impact of abstract visuals.
- Graphical abstracts contribute to enhancing research visibility and advancing towards a visual representation for research.
The Importance of Graphical Abstracts in Scientific Communication
Graphical abstracts play a crucial role in scientific communication by enhancing the visibility and impact of research papers. They provide a visual representation of the key findings and main concepts of a study, making it easier for readers to understand and remember the research.
When researchers publish their work in academic journals, graphical abstracts serve as visual summaries that capture the essence of their study. By presenting the main points in a concise and engaging manner, graphical abstracts help readers quickly grasp the significance of the research and determine whether to delve deeper into the full paper.
Beyond the journal setting, graphical abstracts also have the potential to extend the reach of research. With the rise of social media platforms, researchers can now share their graphical abstracts more widely, reaching not only the scientific community but also the general public. This increased visibility can lead to more citations and collaborations, thus enhancing the overall impact of the research.
Moreover, graphical abstracts play a vital role in advancing towards a visual representation for research. In an age where information is increasingly presented in visual formats, graphical abstracts offer a more accessible and memorable way to communicate complex scientific concepts. By utilizing visual elements such as colors, images, and typography, graphical abstracts engage readers and facilitate better comprehension.
In summary, graphical abstracts are essential tools for effective scientific communication. They enable researchers to visually represent their findings, enhance the visibility of their research, and contribute to the advancement of a visual representation for research. In the next section, we will explore how to create engaging and visually appealing graphical abstracts for journals.
Graphical Abstract Journal How to Make
Understanding the Concept and Purpose of a Graphical Abstract
Before diving into the process of creating graphical abstracts for journals, it is essential to grasp the concept and purpose behind these visual representations. A graphical abstract serves as a concise summary of research findings, allowing readers to quickly grasp the main concepts and key takeaways from a scientific paper. The purpose of a graphical abstract is to provide a visually engaging snapshot of the study, enticing readers to explore the full paper and enhancing the overall visibility and impact of the research.
Design Tips for Creating an Engaging Graphical Abstract
Design plays a crucial role in crafting an engaging graphical abstract. Consider the following design tips for creating impactful graphical abstracts:
- Color: Use a cohesive color scheme that aligns with the research topic and evokes the desired emotional response. Colors can be used to highlight key elements and create visual interest.
- Images: Incorporate relevant and representative images that visually communicate the research findings. Diagrams, charts, and graphs can effectively convey complex information in a clear and concise manner.
- Typography: Choose fonts that are legible and appropriate for the content. Consider using different font sizes, styles, and weights to create visual hierarchy and emphasize important points.
Selecting the Right Tools for Your Graphical Abstract
When creating graphical abstracts, selecting the right tools can streamline the design process and ensure professional results. Here are some recommended digital design tools that researchers can use:
- Adobe Illustrator: A versatile vector graphics editor that provides advanced design capabilities for creating precise and scalable graphical abstracts.
- Canva: An intuitive online design platform with a wide range of templates and graphics, making it ideal for researchers with limited design experience.
- Microsoft PowerPoint: A familiar presentation software that offers basic design features and allows for easy collaboration.
Visual Storytelling Through Graphical Abstracts
The power of graphical abstracts lies in their ability to tell a compelling visual story. By combining elements such as color, imagery, and typography, researchers can create graphical abstracts that captivate and engage readers. Visual storytelling involves structuring the abstract in a narrative format, guiding the audience through the research journey and emphasizing the significance of the findings. Through thoughtful visual storytelling, researchers can enhance the impact of their research communication and effectively convey the essence of their work.

Recommended Design Tools for Graphical Abstracts
| Tool | Description |
|---|---|
| Adobe Illustrator | A versatile vector graphics editor with advanced design capabilities. |
| Canva | An intuitive online design platform with a wide range of templates and graphics. |
| Microsoft PowerPoint | A familiar presentation software with basic design features and collaboration options. |
Best Practices for Effective Abstract Visuals
In this section, we will explore best practices for creating effective abstract visuals that will captivate readers and convey the essence of your research. By incorporating visualization techniques and scientific illustration, you can create visually compelling abstracts that leave a lasting impact. We will also provide template examples and recommend online tools to help you in your abstract creation process.
Incorporating Visualization Techniques and Scientific Illustration
Visualization techniques are powerful tools that allow researchers to present complex data and findings in a visually engaging manner. By utilizing charts, graphs, and diagrams, you can effectively communicate your research and make it more accessible to a wider audience. Scientific illustration, on the other hand, adds depth and clarity to abstract visuals by visually representing concepts, mechanisms, and structures that may be difficult to explain through text alone. By combining visualization techniques and scientific illustration, you can enhance the impact of your abstract and make it more engaging and memorable.
Template Examples and Online Tool Recommendations
Creating an abstract from scratch can be a daunting task, especially if you are new to the process. To help you get started, we have curated a collection of template examples that showcase different layouts, color schemes, and design elements. These templates can serve as a starting point and provide inspiration for your own abstract creation. Additionally, we recommend using online design tools that offer user-friendly interfaces and pre-designed elements to simplify the abstract design process. Some popular online tools for creating abstract visuals include Canva, Piktochart, and Visme. These tools provide a wide range of templates, graphics, and customization options to help you create visually appealing abstracts without the need for advanced design skills.
By incorporating visualization techniques, scientific illustration, and utilizing template examples and online tools, you can elevate your abstract visuals and effectively communicate your research to a broader audience. Remember to keep your visuals concise, informative, and visually appealing to enhance the overall impact of your abstract.
Conclusion
In conclusion, graphical abstracts play a crucial role in enhancing research visibility and advancing towards a visual representation for research. Throughout this article, we have highlighted the importance of graphical abstracts in scientific communication and provided insights on how to create effective and visually compelling ones for journals.
By summarizing key findings and main concepts in a concise and engaging way, graphical abstracts enable readers to quickly understand the main points of a study and make informed decisions about whether to delve into the full paper. Their visual nature also contributes to the promotion of research on social media platforms, increasing the visibility of researchers’ work.
We have discussed the concept and purpose of graphical abstracts, providing design tips and emphasizing the significance of selecting the right tools. We have also explored the concept of visual storytelling through graphical abstracts and the role it plays in enhancing the impact of research communication.
Therefore, we encourage researchers to prioritize the creation of engaging graphical abstracts, as they have the potential to significantly enhance research visibility and contribute to the advancement of a visual representation for research. By incorporating these best practices, researchers can effectively communicate their findings and make a lasting impact in their respective fields, ensuring that their research receives the attention it deserves.
FAQ
What is a graphical abstract?
A graphical abstract is a visual representation of a research paper that summarizes the key findings and main concepts in a concise and engaging way.
Why are graphical abstracts important in scientific communication?
Graphical abstracts enhance the visibility and impact of research papers by providing a visual representation of the key findings and main concepts, making it easier for readers to understand and remember the research.
How do I create an engaging graphical abstract for a journal?
To create an engaging graphical abstract, you can use design tips such as incorporating colors, images, and typography. Additionally, selecting the right tools and utilizing visual storytelling techniques can help create visually compelling abstracts.
What are some best practices for creating effective abstract visuals?
Best practices for creating effective abstract visuals include incorporating visualization techniques, utilizing scientific illustration, and using template examples. Online tools can also be helpful in creating visually appealing abstract visuals.
What is the importance of graphical abstracts in enhancing research visibility?
Graphical abstracts play a crucial role in enhancing research visibility by summarizing research findings in a visually compelling way, which can attract more readers and increase the impact and visibility of the research.
How do graphical abstracts contribute to the advancement of a visual representation for research?
By presenting research findings in a visual format, graphical abstracts contribute to the advancement of a visual representation for research, making it easier for researchers and readers to understand complex concepts and information.