Learn bootstrap resampling for robust inference in statistical analysis. Our guide covers methods, software, and best practices for reliable research results.

Learn bootstrap resampling for robust inference in statistical analysis. Our guide covers methods, software, and best practices for reliable research results.
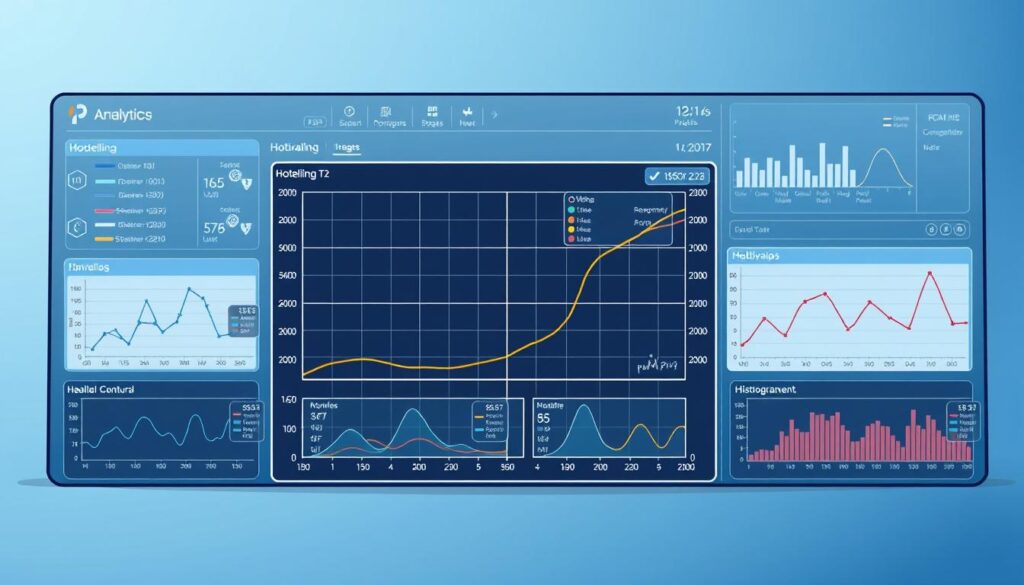
Master Hotelling T2 multivariate control charts. Learn implementation, software compatibility & expert advice for medical research in our how-to guide

“Learn to apply EWMA charts exponential smoothing for predicting medical outcomes. Follow our tutorial for precise statistical analysis”

Detect subtle trends in medical data using cusum charts trend detection. Our guide provides step-by-step instructions for accurate analysis

Shewhart charts healthcare monitoring: Understand its dominance in quality control. Dive into our Ultimate Guide for in-depth knowledge and expert advice