
Imagine you have a medical test that tries to determine if someone has a specific disease. The test can have two outcomes: positive (indicating the person has the disease) or negative (indicating the person doesn’t have the disease). However, no test is perfect. Sometimes it might say someone has the disease when they don’t (a false positive), or it might miss someone who actually has the disease (a false negative).
The Youden Index helps us understand how well the test balances these two types of errors. It’s a simple way to measure the test’s accuracy in correctly identifying people with and without the disease.
To find the Youden Index, we look at a graph called the ROC curve. This curve shows how the test performs at different thresholds (the cutoff points for deciding if a result is positive or negative). The Youden Index is the point on the curve where the test has the best combination of two important factors:
Sensitivity: The ability to correctly identify people with the disease
Specificity: The ability to correctly identify people without the disease
The Youden Index ranges from 0 to 1. A higher Youden Index means the test is better at distinguishing between people who have the disease and those who don’t. It helps doctors choose the optimal threshold for the test, maximizing its overall accuracy.
However, finding the perfect balance between sensitivity and specificity can be challenging. Sometimes, a test might be really good at detecting the disease but also have a high rate of false positives. Other times, a test might miss some people with the disease but have a low rate of false positives. The Youden Index helps find the best compromise between these two factors.
Youden Index Calculator
Use this calculator to compute the Youden Index from your sensitivity and specificity values. Enter values between 0 and 1, and the calculator will instantly show your results with clinical interpretation.
Youden Index Calculator
Enter sensitivity and specificity values to compute the Youden Index (J). Values must be between 0 and 1.
True positive rate
True negative rate
| Youden Index (J) | 0.7500 |
| Interpretation | Good |
| False Positive Rate (1 − Sp) | 10.00% |
| False Negative Rate (1 − Se) | 15.00% |
Formula: J = Se + Sp − 1, where −1 ≤ J ≤ 1. A value of J = 1 indicates a perfect test.
How the Youden Index Works on ROC Curves
The following diagram illustrates how the Youden Index identifies the optimal cutoff point on a Receiver Operating Characteristic (ROC) curve. The Youden Index represents the maximum vertical distance between the ROC curve and the diagonal line of no discrimination.

Visualizing Different Test Scenarios
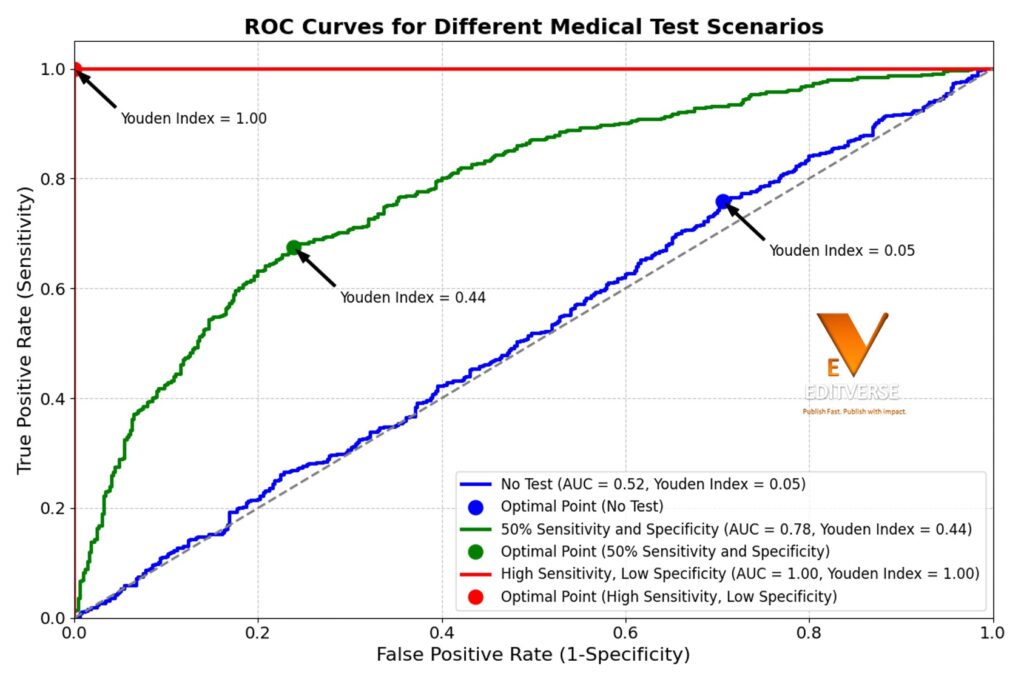
Figure 2: ROC Curves for Different Medical Test Scenarios with Youden Index
This figure illustrates the ROC (Receiver Operating Characteristic) curves for three hypothetical medical test scenarios. The blue curve represents a test with no significant signal (random noise), the green curve represents a test with balanced sensitivity and specificity at 50%, and the red curve represents a test with very high sensitivity (98%) but low specificity (40%). Each curve includes the Area Under the Curve (AUC) and the optimal point based on the Youden Index. The dashed grey line represents the line of no discrimination (AUC = 0.5). The Youden Index values and their corresponding optimal points are annotated on the graph.

Understanding the Youden Index
The Youden Index, also known as Youden’s J statistic, is a key tool in medical testing. It helps evaluate how well tests identify people with diseases and correctly rule out those without. This balance is crucial for making accurate diagnoses.
Definition and Formula
The Youden J statistic combines sensitivity and specificity into one value. It is defined as:
J = Se + Sp − 1
This formula shows the best mix of sensitivity and specificity. The peak value, Jmax, tells us the best cut-off point for a test. The goal is to reduce both false positives and false negatives.
Worked Example
Worked Calculation
Given: A diagnostic test with sensitivity = 0.92 and specificity = 0.88.
Solution:
J = Se + Sp − 1
J = 0.92 + 0.88 − 1
J = 0.80
Interpretation: With J = 0.80, this test demonstrates excellent diagnostic performance (J ≥ 0.75). The false positive rate is 12% and false negative rate is 8%, indicating strong discriminative ability between diseased and non-diseased populations.
Origins and History
W.J. Youden introduced the Youden Index in 1950. It was meant to improve medical testing accuracy. Now, it’s a key tool for testing effectiveness and biomarker validation.
Advances in statistical methods have made the Youden Index more reliable. These methods help deal with the challenges of testing below a limit of detection. This ensures accurate results, even with complex biomarkers.
Key Definitions
- Sensitivity (Se)
- The proportion of true positives correctly identified by the test. Calculated as Se = TP / (TP + FN), where TP = true positives and FN = false negatives. Also called the True Positive Rate (TPR).
- Specificity (Sp)
- The proportion of true negatives correctly identified by the test. Calculated as Sp = TN / (TN + FP), where TN = true negatives and FP = false positives. Also called the True Negative Rate (TNR).
- Youden Index (J)
- A single statistic capturing diagnostic test performance. Defined as J = Se + Sp − 1, representing the maximum vertical distance from the ROC curve to the diagonal line of no discrimination. Range: −1 to 1.
- ROC Curve
- Receiver Operating Characteristic curve. A graphical plot showing the diagnostic ability of a binary classifier as its discrimination threshold varies. Plots Sensitivity (y-axis) against 1-Specificity (x-axis).
Reference Tables
Sensitivity, Specificity, and Youden Index with Implications
| Sensitivity | Specificity | Youden Index (J) | Implications |
|---|---|---|---|
| 1.00 | 1.00 | 1.00 | Perfect test, ideal diagnostic tool |
| 0.90 | 0.85 | 0.75 | Excellent test, highly reliable |
| 0.80 | 0.90 | 0.70 | Very good test, generally reliable |
| 0.70 | 0.95 | 0.65 | Good test, suitable for use |
| 0.85 | 0.80 | 0.65 | Good test, suitable for use |
| 0.50 | 1.00 | 0.50 | Moderate test, limited application |
| 0.60 | 0.70 | 0.30 | Fair test, caution advised |
| 0.40 | 0.90 | 0.30 | Fair test, caution advised |
| 0.30 | 0.80 | 0.10 | Poor test, not recommended |
| 0.20 | 0.50 | −0.30 | Inadequate test, misleading results |
Youden Index Interpretation Guidelines
Clinical Interpretation of Youden Index Values
| J Value Range | Classification | Clinical Recommendation |
|---|---|---|
| 0.75 − 1.00 | Excellent | Suitable as standalone diagnostic criterion |
| 0.50 − 0.74 | Good | Appropriate for clinical screening |
| 0.25 − 0.49 | Moderate | Requires confirmatory testing |
| < 0.25 | Poor | Limited clinical utility |
Note: Interpretation thresholds are conventional guidelines. Clinical context should inform final assessment.
Key Takeaways
- The Youden Index helps optimize diagnostic test accuracy by balancing sensitivity and specificity.
- Sensitivity and specificity are crucial measures in medical statistics for assessing diagnostic tests.
- The optimal Youden Index value is 1.0, indicating a perfect test with no false positives or false negatives.
- ROC curve analysis is integral in identifying the optimal Youden Index cut-off point.
- Various methods complement the Youden Index to improve diagnostic performance.

How the Youden Index is Calculated
The Youden Index is a vital tool in evaluating diagnostic tests. It combines sensitivity and specificity to measure a test’s effectiveness.
Step 1: Determine Sensitivity
Sensitivity is about true positives. It shows how many actual positives the test correctly spots. For instance, in a study with 200 patients aged 40-60, the B-Glucose test correctly identified 95% of those with the disease.
The formula for sensitivity is:
Sensitivity = TP / (TP + FN)
Step 2: Determine Specificity
Specificity is about true negatives. It’s the rate of correctly identifying those without the disease. The same study showed the B-Glucose test correctly identified 85% of healthy individuals.
The formula for specificity is:
Specificity = TN / (TN + FP)

Step 3: Combine Sensitivity and Specificity
Now, let’s combine sensitivity and specificity to get the Youden Index (J). The formula is:
J = Sensitivity + Specificity − 1
This formula helps find the best cutoff point for the test. For example, with sensitivity of 0.95 and specificity of 0.85, the Youden Index is 0.80. Finding the maximum Youden Index (Jmax) helps pinpoint this optimal value.
The Youden Index improves diagnostic tools by making them more reliable. It’s crucial for refining diagnostic tests, whether using parametric or non-parametric methods.
Importance of the Youden Index in Diagnostic Tests
The Youden Index is key to making diagnostic tests better. It helps find the best cutoff points. This balance makes tests more accurate by focusing on both sensitivity and specificity. A high Youden Index means the test is very accurate, reducing wrong diagnoses.
Optimizing Cutoff Points
Finding the right cutoff points is like hitting the bullseye in archery. The Youden Index helps pinpoint the best point to separate positive from negative results. This makes the test more effective and improves patient care by cutting down on false results.
Balancing Sensitivity and Specificity
The Youden Index is crucial for balancing test performance. It looks at how well the test identifies those with and without the disease. This balance is key for doctors to make accurate diagnoses and care for patients well.
The 13C-urea breath test for H. Pylori is a good example. It correctly identifies most cases and correctly says who doesn’t have it. This shows how the Youden Index helps make sure a test is effective and balanced.
“A diagnostic test with a large positive LR (>5.0) indicates a large shift in odds favoring the condition with a positive test result, making the Youden Index incredibly useful in evaluating such shifts.”
Example: Diagnostic Indices Summary
| Diagnostic Index | Value |
|---|---|
| Sensitivity (Sn) | 64% |
| Specificity (Sp) | 53% |
| Positive Predictive Value (PPV) | 12% |
| Negative Predictive Value (NPV) | 94% |
| Positive Likelihood Ratio (LR+) | 1.36 |
| Negative Likelihood Ratio (LR−) | 0.68 |
In summary, the Youden Index is a powerful tool that enhances the precision of diagnostic tests. It helps optimize cutoff points and ensures a balance in test performance for better accuracy.
Comparison with Other Diagnostic Accuracy Measures
It’s key to compare the Youden Index with other tools like the receiver operating characteristic curve and likelihood ratios. This helps us understand how well a diagnostic test works. We get a full view of a test’s effectiveness by looking at these different methods.
Area Under the Curve (AUC)
The area under the curve, or AUC, shows how well a test does at all possible levels. It’s a score from 0 to 1, with higher scores meaning better performance. Sensitivity and specificity are key to figuring out the AUC. They tell us how well a test spots true positives and true negatives.
The receiver operating characteristic curve shows sensitivity versus 1-specificity visually. This makes it easy to see how accurate a test is. The Youden Index looks at a single best threshold for sensitivity and specificity. These tools together help us evaluate and compare diagnostic tests well.
Likelihood Ratios
Likelihood ratios (LRs) are important for judging diagnostic tests. A positive LR tells us how much more likely a patient with the disease tests positive. A negative LR shows how unlikely a negative test is in someone with the disease. High values for LR+ and low values for LR− mean a test is very good at making accurate decisions.
“LR+ is the best indicator for ruling in a diagnosis, while LR− is crucial for ruling out the diagnosis.”
Using the Youden Index and likelihood ratios gives us a detailed look at how tests perform in real situations. Each tool gives different insights. The Youden Index finds the best cutoff points, and LRs give us a chance to understand the probability of a test result.
These measures together help us use diagnostic tests better. By combining the receiver operating characteristic curve, area under the curve, and likelihood ratios, we make sure our tests are accurate, dependable, and right for the clinic.
Application of the Youden Index in Medical Tests
The Youden Index is a powerful tool in medical tests. It helps find the best cutoff points for tests. This balance between sensitivity and specificity is key for accurate diagnoses. Let’s explore how the Youden Index works in real medical situations with examples.
Commonly Used Scenarios
In biomedical diagnosis, the Youden Index is widely used. It finds the best cut-point to improve test results. For example, it can set a lactate level threshold to predict mortality effectively.
The index uses a formula to find the best threshold. This formula is flexible and works well in different disease stages.
“The ROC (Receiver Operating Characteristic) curve, frequently used in biomedical research, illustrates test sensitivity versus 1-specificity, with AUROC representing the global discriminative ability,” notes statistical research.
Most tests focus on two groups, missing the middle stages of disease. But new methods now apply the Youden Index to three groups. This makes it more useful in complex medical tests.
Examples in Practice
There are many examples of the Youden Index in action. Imagine a clinic trying to find the best cut-off for a test. The Youden Index helps make this decision by analyzing the ROC curve.
For instance, a test might show a sensitivity of 0.46 and specificity of 0.74 for lactate levels above 2 mmol/l. The Youden Index helps find the best cut-off value. This improves the test’s effectiveness under different conditions.
This method is crucial for better disease detection and decision-making in clinics.
Another example is using a diagnostic tool to spot high-risk patients. The Youden Index measures sensitivity and specificity well. It also provides confidence intervals for three diagnostic groups, giving a full picture of accuracy.
Calculating expected costs based on the Youden Index helps doctors see the financial impact of their decisions. This shows the practical benefits of using the Youden Index.
The Youden Index in Receiver Operating Characteristic (ROC) Curves
The Youden Index is very important in diagnostic test analysis, especially with ROC curves. It finds the best balance between sensitivity and specificity. This balance is key to making a test more accurate.
A 2011 study by Daubin C et al. looked at using serum neuron-specific enolase to predict outcomes in comatose cardiac arrest survivors. They used ROC curves for this. Another study by Darmon M et al. in 2011 looked at using fractional excretion of urea to diagnose acute kidney injury in critically ill patients. Both studies showed how important ROC curves are in testing.
A ROC curve shows how specific and sensitive a test is at different levels. The Youden Index helps find the best mix of these qualities. This makes it very useful for doctors who want to improve their tests. A 2008 study by Reddy S et al. showed how using the Youden Index with lactate dehydrogenase and other enzymes helps diagnose better.
Table of Key Studies Using ROC Curves and Youden Index
| Study | Year | Test/Parameter |
|---|---|---|
| Daubin C et al. | 2011 | Serum neuron-specific enolase |
| Darmon M et al. | 2011 | Fractional excretion of urea |
| Reddy S et al. | 2008 | Lactate dehydrogenase, creatine kinase |
| Hajian-Tilaki KO et al. | 2011 | BMI and waist circumference |
A 2011 study by Hajian-Tilaki KO et al. looked at BMI and waist circumference as predictors of breast cancer risk in Iranian women. They used ROC curves to analyze these predictors. These studies show how the Youden Index in ROC curves helps improve diagnostic tests.
For more info, the ROC curve analysis is key to finding the best cutoff points. This ensures tests are as accurate as possible. The Youden Index is a crucial tool in this process, making it vital in medical research and practice.
Limitations of the Youden Index
The Youden Index simplifies how we check if a test is accurate. But, it depends too much on how common the disease is.
Dependence on Prevalence
A big issue with the Youden Index is how it changes with disease frequency. Tests can look better or worse in different groups of people. This impact of prevalence means we must consider the test in the right population.
Tests aim to be both sensitive and specific. But the Youden Index, by focusing on these, doesn’t always show the whole story. For conditions that are not just yes or no, the index might miss important details. Adding more information and adjusting for bias helps, but we must remember the limits of the Youden Index in complex cases.
Simplicity vs. Complexity
The Youden Index is easy to understand. But, it might not be enough for complex health issues. These conditions often need more than just two numbers to be diagnosed correctly. The dissertation talks about how to get more precise results and different ways to look at tests, but the Youden Index is limited. Doctors should use more than just this method when making decisions.
In short, the Youden Index is useful for testing, but it has its limits. It relies too much on disease frequency and is too simple. We need other ways to fully understand medical tests.
Limitations of the Youden Index and Solutions with Examples
| Limitation | Solution or Approach | Example |
|---|---|---|
| Dependent on Cut-off Point | Use methods like ROC curve analysis to determine the optimal cut-off point that maximizes the Youden Index. | Determining a threshold in a glucose test to optimize the identification of pre-diabetes. |
| Doesn’t Account for Prevalence | Employ predictivity-based ROC curves or the P-index, which adjust for disease prevalence, providing a more accurate reflection of test effectiveness. | Using the P-index in cancer screening to adjust for lower prevalence in younger populations. |
| Misleading Without Covariate Adjustment | Adjust the Youden Index for relevant covariates using statistical models to reduce bias, especially in diverse populations. | Adjusting for age and gender in a cholesterol test to better predict cardiovascular risks. |
| Ignores Correlation Between Se and Sp | Conduct comprehensive analyses using 2×2 contingency tables and statistical tests that account for the correlation between sensitivity and specificity. | Analyzing a diagnostic test for COVID-19 where both sensitivity and specificity are crucial for outcomes. |
| Influenced by Disease Prevalence | Use alternative statistical measures like the overlap coefficient, which assess the similarity between the distributions of test results for diseased and non-diseased groups. | Applying the overlap coefficient in diagnostic tests for rare genetic disorders. |
| Sensitivity to Chosen Test Parameters | Combine the Youden Index with other diagnostic performance measures like the area under the ROC curve (AUC), which are less sensitive to specific test parameters and provide a broader evaluation. | Integrating AUC in evaluating the effectiveness of a new Lyme disease test. |
Advanced Metrics Related to Diagnostic Test Accuracy
When we look deeper into diagnostic tests, we find metrics like Positive Predictive Value (PPV) and Negative Predictive Value (NPV) important. These, along with F-measure and Matthews Correlation Coefficient (MCC), give us more insight than just sensitivity and specificity. They help us understand how well tests perform in real situations.
Positive Predictive Value (PPV) and Negative Predictive Value (NPV)
PPV tells us the chance a positive test result means the disease is present. NPV shows the chance a negative test result means the disease is not present. These values are key in making decisions after the test. For a detailed look at PPV and NPV, see this resource.
F-measure and Matthews Correlation Coefficient (MCC)
The F-measure combines precision and recall into one score. It’s useful when both are equally important. The Matthews Correlation Coefficient (MCC) is a strong metric that looks at all four outcomes of a test together. For a deep dive into MCC, check out this paper.
Using these advanced metrics boosts the accuracy of medical tests. By combining PPV, NPV, F-measure, and MCC, doctors get a full picture of how accurate tests are. These metrics are listed in the table below:
| Metric | Definition | Use Case |
|---|---|---|
| PPV | Probability that positive results are true positives | Post-test probability assessment |
| NPV | Probability that negative results are true negatives | Post-test probability assessment |
| F-measure | Harmonic mean of precision and recall | Balancing precision and recall |
| MCC | Correlation coefficient for binary classifications | Summary measure for test performance |
Healthcare professionals use these advanced metrics to understand the fine details of diagnostic tests. This helps them make better decisions. Learn more about their impact on diagnostic accuracy in this study.
Conclusion
The Youden Index is a key tool for evaluating diagnostic tests. It combines sensitivity and specificity into one metric. This makes it a powerful way to measure how well a test performs.
Researchers use the Youden Index to find the best cutoff points. This balance helps get better results in diagnosing diseases. It’s useful in many situations, like checking the accuracy of two biomarkers or dealing with diseases that are not fully healthy or sick.
The Youden Index is reliable and flexible. It can handle different types of diseases and adjust for other factors. This is backed by many studies, as seen in numerous studies.
But, the Youden Index has its limits. It can be affected by how common a disease is and might not work well for complex cases. Still, when paired with other methods like the area under the ROC curve, it’s very effective.
Using the Youden Index wisely can greatly improve medical diagnostics. This can lead to better health outcomes for patients, as shown in research findings.
Frequently Asked Questions
What is the Youden Index?
The Youden Index, also known as Youden’s J statistic, is a way to check how well a diagnostic test works. It uses the formula J = sensitivity + specificity − 1. This formula helps find the best cutoff for the test.
Who developed the Youden Index?
W.J. Youden created the Youden Index in 1950. His work has become a key part of medical statistics. It gives a single score to measure how correct a test is.
How is the Youden Index calculated?
To find the Youden Index, you need to know the test’s sensitivity and specificity. The formula is J = sensitivity + specificity − 1. This gives a single score to find the best cutoff point.
What do sensitivity and specificity mean in the context of the Youden Index?
Sensitivity is how well a test spots actual positives. Specificity is how well it spots actual negatives. Both are key for the Youden Index and test accuracy.
Why is the Youden Index important for diagnostic tests?
The Youden Index is key because it balances sensitivity and specificity. This balance helps a test correctly tell apart positive and negative results. It reduces wrong diagnoses and improves patient care.
How does the Youden Index compare with other diagnostic accuracy measures like the Area Under the Curve (AUC) and Likelihood Ratios?
The Youden Index focuses on balancing sensitivity and specificity at one point. AUC looks at test performance across different points. Likelihood Ratios show the test’s outcome probabilities in patients with or without a condition. Each measure gives different insights into test accuracy.
In what medical testing scenarios is the Youden Index most useful?
The Youden Index is most useful in medical tests needing clear cutoff points. This is true for screenings like cancer or infection tests, where correct results are crucial for patient care.
What role does the Youden Index play in analyzing Receiver Operating Characteristic (ROC) curves?
In ROC curves, the Youden Index finds the best point for test performance. It shows the threshold with the highest sensitivity and specificity. This helps in choosing the best diagnostic test cutoff.
What are the limitations of the Youden Index?
The Youden Index has limits, like being affected by the disease’s prevalence. It’s simple and might not capture all the complexity of some tests. So, other factors should also be considered.
How do advanced metrics like Positive Predictive Value (PPV), Negative Predictive Value (NPV), F-measure, and Matthews Correlation Coefficient (MCC) relate to the Youden Index?
Metrics like PPV and NPV show the condition’s likelihood with a test result. The F-measure and MCC look at precision and recall harmony and correlation in binary classifications. These metrics add to the Youden Index, giving a deeper look at test accuracy.
Source Links
- https://www.ncbi.nlm.nih.gov/pmc/articles/PMC5470053/ − Defining an Optimal Cut-Point Value in ROC Analysis: An Alternative Approach
- https://bmcmedresmethodol.biomedcentral.com/articles/10.1186/s12874-024-02198-2 − Methods of determining optimal cut-point of diagnostic biomarkers with application of clinical data in ROC analysis: an update review
- https://turkjemergmed.com/full-text/851 − Receiver operating characteristic curve analysis in diagnostic accuracy studies: A guide to interpreting the area under the curve value
- https://www.ncbi.nlm.nih.gov/pmc/articles/PMC2515362/ − Youden Index and Optimal Cut-Point Estimated from Observations Affected by a Lower Limit of Detection
- https://journals.plos.org/plosone/article?id=10.1371/journal.pone.0127272 − Improved Confidence Intervals for the Youden Index
- https://www.sciencedirect.com/topics/medicine-and-dentistry/youden-index − Youden Index − an overview
- https://en.wikipedia.org/wiki/Youden’s_J_statistic − Youden’s J statistic
- https://www.ncbi.nlm.nih.gov/pmc/articles/PMC2749250/ − Youden Index and the optimal threshold for markers with mass at zero
- https://www.ncbi.nlm.nih.gov/pmc/articles/PMC4975285/ − Measures of Diagnostic Accuracy: Basic Definitions
- https://www.ncbi.nlm.nih.gov/pmc/articles/PMC9519267/ − How to Analyze the Diagnostic Performance of a New Test? Explained with Illustrations
- https://www.ncbi.nlm.nih.gov/pmc/articles/PMC3685301/ − Youden index and Associated Cut-points for Three Ordinal Diagnostic Groups
- https://bmcmedresmethodol.biomedcentral.com/articles/10.1186/1471-2288-10-89 − A note on Youden’s J and its cost ratio
- https://www.ncbi.nlm.nih.gov/pmc/articles/PMC3755824/ − Receiver Operating Characteristic (ROC) Curve Analysis for Medical Diagnostic Test Evaluation
- https://www.degruyter.com/document/doi/10.1515/ijb-2018-0060/html?lang=en − The Youden Index in the Generalized Receiver Operating Characteristic Curve Context
- https://www.medcalc.org/manual/roc-curves.php − ROC curve analysis
- https://www.mdpi.com/2227-7390/10/8/1221 − A Stepwise Algorithm for Linearly Combining Biomarkers under Youden Index Maximization
- https://www.biochemia-medica.com/en/journal/26/3/10.11613/BM.2016.034 − On determining the most appropriate test cut-off value: the case of tests with continuous results
- https://www.degruyter.com/document/doi/10.1515/tjb-2020-0337/html?lang=en − Evaluation of binary diagnostic tests accuracy for medical researches
- https://www.e-epih.org/journal/view.php?doi=10.4178/epih.e2022083 − Meta-analysis of diagnostic test accuracy studies with multiple thresholds for data integration
- https://www.medrxiv.org/content/10.1101/2020.04.01.20050567.full − Screening for dementia: Q* index as a global measure of test accuracy revisited