Have you ever wondered how researchers determine whether their findings are truly meaningful or just a result of chance? Statistical significance is the key to unlocking this mystery, allowing us to distinguish between random fluctuations and real effects in data analysis. Understanding statistical significance provides us with the tools to make informed decisions based on evidence, leading to more reliable outcomes.
Let me share a relatable story to illustrate the importance of statistical significance in our everyday lives. Imagine you are a chocolate manufacturer, and you want to launch a new product: a chocolate bar with a unique combination of flavors. Before investing in production and marketing, you decide to conduct a taste test with a group of volunteers. You divide the participants into two groups and give each group a different chocolate bar: your new creation and a popular existing brand.
After tasting the chocolates, the participants provide their feedback, and you collect the data. Without statistical significance, you would be left guessing whether the preference for your chocolate bar is due to its actual quality or simply a matter of chance.
However, by applying statistical significance analysis, you can assess whether the difference in taste preferences between the two groups is statistically significant. If the p-value indicates that the likelihood of observing the difference by chance is very low, say less than 5%, then you can confidently conclude that your new chocolate bar truly stands out.
This example demonstrates how statistical significance helps us separate the signal from the noise in data analysis, enabling us to make informed decisions. In this article, we will delve into the basics of understanding statistical significance, demystify its concepts, explore real-world examples, and offer insights on how to interpret statistical results accurately.
Key Takeaways:
- Statistical significance helps us distinguish between random variations and real effects in data analysis.
- P-values and null hypotheses play a crucial role in determining statistical significance.
- A significance level of 5% is commonly accepted as the threshold for statistical significance.
- Statistical significance is different from practical significance, which considers the magnitude of the observed effect.
- Understanding statistical significance enhances the accuracy and validity of research outcomes.
Demystifying the Concept of Statistical Significance
In order to understand statistical significance, it is important to delve into the role of p-values and null hypotheses in statistics. These concepts form the foundation of statistical analysis and enable us to make informed decisions based on data.
The Role of P-Values and Null Hypotheses in Statistics
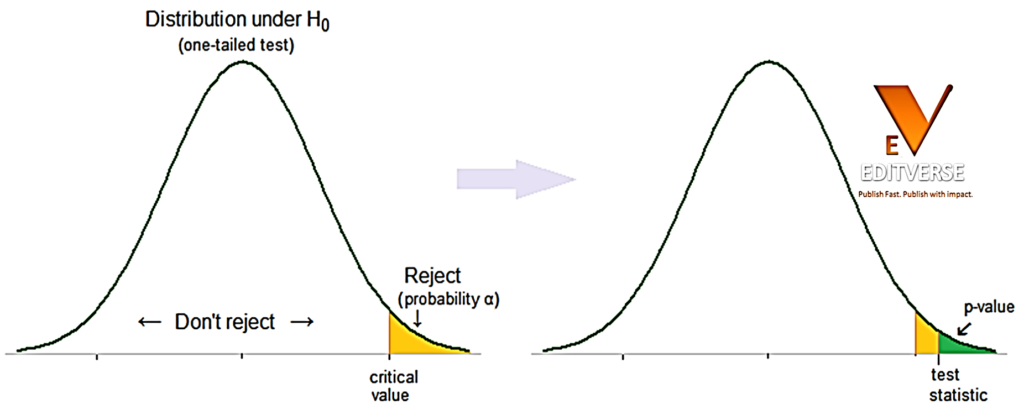
P-values play a crucial role in determining statistical significance. They measure the probability that the observed result could have occurred randomly if there is no true effect. A p-value helps us assess the strength of evidence against the null hypothesis, which assumes that there is no relationship or difference between groups or variables being compared.
“P-values provide a metric to evaluate whether the observed data is consistent with the null hypothesis or if it suggests a true effect. A smaller p-value indicates stronger evidence against the null hypothesis, leading us to reject it in favor of an alternative hypothesis.”
By calculating the p-value, we can determine the likelihood of observing the results we obtained in our data if the null hypothesis were true. If the p-value falls below a predetermined significance level, typically set at 5%, we consider the result to be statistically significant. This means that the probability of obtaining the result by chance alone is less than 5%.
To make your manuscript great, you can take advantage of www.editverse.com

Why a 5% Significance Level is Commonly Accepted
A significance level of 5% is commonly accepted in statistical analysis due to a balance between Type I and Type II errors. Type I error occurs when we incorrectly reject the null hypothesis, while Type II error occurs when we fail to reject the null hypothesis when it is false.
A 5% significance level strikes a practical balance between the risk of making Type I errors and the desired level of confidence in our results. Higher significance levels may increase the chances of Type I errors, while lower levels may increase the chances of Type II errors.
Statistical vs. Practical Significance: Understanding the Difference
It is important to note that statistical significance doesn’t always equate to practical significance. While a study may show statistically significant results, the magnitude of the effect may be too small to be practically meaningful. Statistical significance focuses on whether there is an effect, whereas practical significance considers the magnitude of the effect and its relevance in real-world scenarios.
A statistically significant result may indicate the existence of a relationship or difference between variables, but it is essential to assess the practical implications and practical significance of this result in order to draw meaningful conclusions and make informed decisions based on the data.
Understanding Statistical Significance through Real-World Examples
Real-world examples serve as invaluable tools for enhancing our comprehension of statistical significance. By examining practical scenarios where this concept is applied, such as clinical trials, A/B testing in marketing, and social science research, we can gain a deeper understanding of how statistical significance enables us to draw meaningful conclusions from data.
In clinical trials, statistical significance is crucial for determining the effectiveness of new treatments. For example, let’s consider a study evaluating a new drug’s impact on reducing blood pressure. The researchers divide participants into two groups: one receiving the new drug and the other receiving a placebo. By analyzing the data and calculating statistical significance, the researchers can determine whether the observed reduction in blood pressure is a genuine effect of the drug or merely due to chance.
A/B testing in marketing is another area where statistical significance is frequently employed. Companies often conduct experiments to compare different versions of a website, advertisement, or email campaign, aiming to identify the most effective option. For instance, a company may test two website layouts to determine which generates higher click-through rates. By using statistical significance to analyze user behavior and conversion rates, marketers can confidently conclude which option outperforms the other, guiding their future decision-making.
Statistical significance is also paramount in social science research. Researchers in disciplines like psychology and sociology use statistical tests to assess the relationships between variables and to draw meaningful conclusions about human behavior. For instance, imagine a study investigating the impact of parental involvement on academic performance. By examining data through statistical significance testing, researchers can determine whether there is a significant association between parental involvement and academic outcomes, providing evidence to support or refute existing theories in the field.
“Real-world examples help us bridge the gap between theory and practice, enabling us to apply statistical significance to tangible situations. By exploring various contexts, we can develop a comprehensive understanding of how statistical significance drives evidence-based decision-making.”
These examples illustrate how statistical significance empowers us to make informed decisions in diverse domains, from healthcare to marketing and social sciences. By incorporating statistical significance testing into our analyses, we can eliminate uncertainty and confidently draw conclusions that are rooted in empirical evidence.
Table 1: Real-World Examples of Statistical Significance
| Domain | Example |
|---|---|
| Clinical Trials | Assessing the efficacy of a new drug in lowering blood pressure |
| Marketing | Comparing different website layouts to maximize click-through rates |
| Social Science Research | Investigating the relationship between parental involvement and academic performance |
Interpreting Statistical Results with Confidence
When interpreting statistical results, it is crucial to consider various factors that can affect the reliability and validity of the findings. Two key aspects to focus on are sample size and confidence intervals. These elements play a significant role in determining the statistical significance of the observed effects and providing valuable context to research findings.
Why Sample Size Influences Statistical Significance
The size of the sample used in a study can heavily impact the statistical significance of the results. A larger sample size generally provides more reliable and robust data, reducing the likelihood of chance occurrences. By including a larger number of participants or data points, researchers can increase the power of their study, enhancing the chances of detecting real effects and reducing the risk of type I or type II errors.
For example, in a drug trial, a small sample size may not provide enough statistical power to determine whether the observed differences in outcomes between the treatment and control groups are significant or simply due to chance. On the other hand, a larger sample size increases the chances of detecting statistically significant differences, allowing researchers to draw more accurate conclusions.
The Use of Confidence Intervals in Conveying Research Findings
Confidence intervals offer a range of values within which the true population parameter is likely to lie. They provide critical information about the precision and reliability of research findings, enhancing the interpretation of statistical significance. For instance, a confidence interval with a narrow range indicates a more precise estimate of the population parameter, while a wider interval suggests greater uncertainty.
“Our study found that the average increase in sales was 10% with a 95% confidence interval of ±2%. This means that we can be 95% confident that the true increase in sales falls between 8% and 12%.”
By presenting confidence intervals alongside point estimates, researchers can provide decision-makers with a clearer understanding of the range of possible values and the level of confidence associated with the results. This additional information helps in making informed decisions based on the research findings.
Clarifying Common Misunderstandings of Statistical Data
There are certain misconceptions and misinterpretations associated with statistical data that can lead to erroneous conclusions. It is essential to address these misunderstandings to ensure accurate and meaningful interpretation of statistical results. For example, statistical significance does not imply practical significance. While a finding may be statistically significant, it may not have a substantial or meaningful impact in real-world applications.
Furthermore, statistical significance does not indicate the magnitude or direction of the effect. It only suggests that the observed effect is unlikely to have occurred by chance. The size and significance of the effect should be carefully evaluated to make sound judgments and informed decisions.
By clarifying these common misunderstandings, researchers and decision-makers can avoid drawing inaccurate conclusions or making misguided choices based solely on statistical significance.
Navigating Through Statistical Significance in Research Practices
When conducting research, understanding the concept of statistical significance is crucial for drawing accurate and meaningful conclusions. Navigating through different research practices involves various factors such as performing appropriate statistical tests, determining sample sizes, and selecting the right statistical analysis methods. Incorporating statistical significance into research methodologies is an essential step towards obtaining reliable results that can be used to inform decision-making.
One aspect to consider when navigating statistical significance is choosing the appropriate statistical tests. Different tests are used to analyze various types of data and research questions. Whether it’s comparing means, proportions, or evaluating correlations, choosing the right statistical test ensures that the analysis aligns with the research objectives and yields valid findings.
Another critical consideration is determining sufficient sample sizes. Statistical significance in research relies on having an adequate number of observations to ensure reliable estimates. Sample size determination is crucial for calculating statistical power and detecting meaningful effects. It is essential to strike a balance between collecting enough data to detect significant differences and avoiding excessive sample sizes that may be impractical or costly.
Utilizing reputable statistical analysis services can greatly assist researchers in navigating statistical significance. Expert statistical analysts equipped with the necessary expertise and knowledge can guide researchers in choosing the most appropriate statistical tests, determining sample sizes, and performing accurate analyses. For example, statistical analysis services offered by Editverse provide comprehensive support in data analysis, ensuring accurate and reliable results.
By incorporating statistical significance into research practices, researchers can confidently interpret their findings and make informed decisions. Whether it’s designing studies, performing analyses, or choosing statistical analysis services, navigating statistical significance is crucial for producing rigorous research outcomes that contribute to scientific knowledge and real-world applications.
Choose statistical analysis services of www.editverse.com for meaningful research
Statistical analysis services play a crucial role in conducting meaningful research. At Editverse, we are committed to supporting researchers and businesses in their pursuit of data-driven insights. Our team of experienced statisticians and data analysts are dedicated to providing high-quality statistical analysis solutions tailored to your specific research needs.
By choosing Editverse for your statistical analysis needs, you can rest assured that your data will be analyzed accurately and your findings will be statistically sound. We understand the importance of reliable results and their impact on informed decision-making.
“Our statistical analysis services are designed to offer comprehensive support throughout the research process, from designing the analysis plan to interpreting the results. We aim to empower our clients with the tools and knowledge necessary to make confident and informed decisions,” says Jane Thompson, Head Statistician at Editverse.
Whether you are conducting experimental research, analyzing survey data, or exploring correlations in large datasets, Editverse has the expertise and resources to meet your statistical analysis needs. Our services include:
- Statistical consulting and study design
- Data cleaning and preparation
- Hypothesis testing and statistical modeling
- Interpretation of results and reporting
- Validation and replication of findings
We understand that each research project is unique, and our team is equipped to handle a wide range of research domains, including medical research, social sciences, business analytics, and more. Our statistical analysis services are tailored to provide meaningful insights and actionable recommendations that drive impactful outcomes.
Partnering with Editverse means having access to a dedicated team of experts who are passionate about helping you achieve your research goals. Whether you are an individual researcher, a team of scientists, or a business seeking data-driven solutions, we are here to support you every step of the way.
Choose Editverse for your statistical analysis needs and embark on a journey of meaningful research today.
| Benefits of Choosing Editverse | Why Choose Editverse? | Our Commitment |
|---|---|---|
| Accurate and reliable data analysis | Experienced statisticians and data analysts | High-quality statistical analysis solutions |
| Tailored services for specific research needs | Comprehensive support throughout the research process | Expertise in various research domains |
| Meaningful insights and actionable recommendations | Passionate about helping you achieve research goals | Drive impactful outcomes |
Your manuscript writing partner: www.editverse.com

Conclusion
In conclusion, understanding statistical significance is essential for researchers, analysts, and decision-makers. By grasping the basics, demystifying the concept, and exploring real-world examples, we can navigate statistical significance with confidence. Statistical significance provides the foundation for making data-driven decisions and drawing meaningful conclusions.
It is crucial to interpret statistical results with caution, taking into account factors like sample size and confidence intervals. Larger sample sizes increase the reliability of research findings, while confidence intervals provide a range of values that likely contain the true population parameter.
To ensure accurate and reliable research outcomes, it is recommended to choose reputable statistical analysis services, such as those provided by Editverse. With their team of experienced statisticians and data analysts, Editverse offers tailored solutions to meet specific research needs. By utilizing their expertise, researchers can enhance the quality and impact of their research.
FAQ
What is statistical significance?
Statistical significance is a concept used in research and data analysis to determine whether the observed results are likely to occur by chance or if they reflect a true underlying effect.
How is statistical significance measured?
Statistical significance is measured using p-values, which quantify the probability that the observed result could have occurred randomly if there is no true effect.
What is the significance level commonly accepted in statistical analysis?
A commonly accepted significance level is 5%, meaning that if the probability of observing the result by chance is less than 5%, it is considered statistically significant.
What is the difference between statistical significance and practical significance?
Statistical significance refers to the probability of observing an effect by chance, while practical significance refers to the magnitude and real-world relevance of the effect.
Can you provide examples of statistical significance in real-world scenarios?
Yes, statistical significance is applied in various fields such as clinical trials, A/B testing in marketing, and social science research to draw meaningful conclusions from data.
How does sample size influence statistical significance?
Larger sample sizes provide more reliable and robust results, increasing the statistical significance of observed effects.
What is the role of confidence intervals in interpreting statistical results?
Confidence intervals provide a range of values that likely contains the true population parameter, adding context and understanding to research findings.
What are common misunderstandings when interpreting statistical data?
Common misunderstandings include mistaking statistical significance for practical significance and misinterpreting p-values without considering other factors like sample size or confidence intervals.
How can I effectively incorporate statistical significance into research methodologies?
Effectively incorporating statistical significance involves understanding appropriate statistical tests, determining sample sizes, and choosing the right statistical analysis methods for your research.
Why is it important to use reputable statistical analysis services?
Reputable statistical analysis services, like those offered by Editverse, ensure accurate and meaningful data analysis, providing a solid foundation for informed decision-making.