In the world of epidemiology, researchers are constantly seeking ways to improve the accuracy and reliability of their analyses. One increasingly popular approach is the use of Bayesian methods, which offer a unique perspective on handling complex data and incorporating prior knowledge. In this blog post, we’ll explore the what, why, and how of Bayesian methods in epidemiology.
Why Use Bayesian Methods?
Incorporating Prior Knowledge
Bayesian methods allow epidemiologists to incorporate existing knowledge or beliefs about the disease or risk factors into the analysis, leading to more accurate and informative results.
Handling Complex Models
Bayesian methods are well-suited for analyzing complex epidemiological models with many parameters and interactions, as they can account for the uncertainty in these parameters.
Dealing with Missing Data
Bayesian methods can handle missing data by treating it as another unknown parameter to be estimated, which can lead to more accurate results compared to traditional methods that may exclude or impute missing data.
Providing Probabilistic Interpretations
Bayesian methods provide results in the form of probability distributions, which can be more intuitive and informative than point estimates and confidence intervals obtained from frequentist methods.
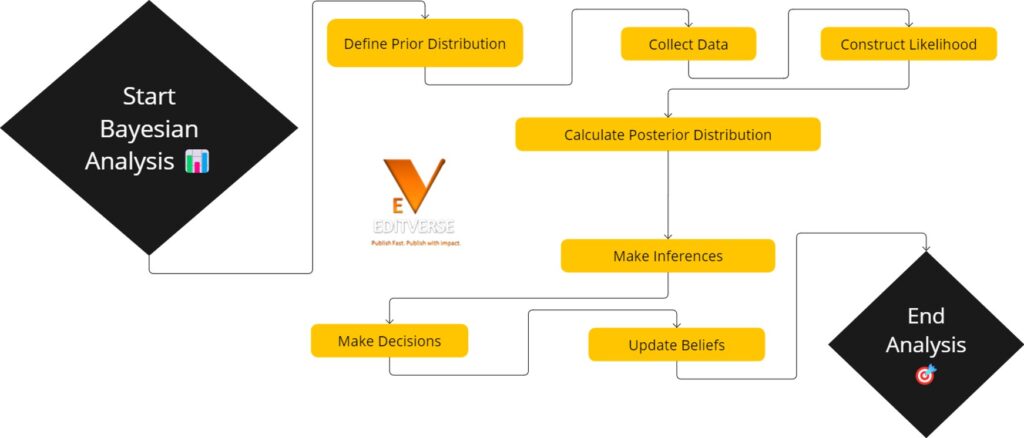
How to Apply Bayesian Methods
1. Specify Prior Distributions
The first step in Bayesian analysis is to specify prior probability distributions for the model parameters based on existing knowledge or expert opinion.
2. Collect Data
Obtain relevant epidemiological data through observational studies, surveys, or experiments.
3. Construct the Likelihood Function
Create a likelihood function that describes the probability of observing the data given the model parameters.
4. Calculate the Posterior Distribution
Use Bayes’ theorem to combine the prior distributions with the likelihood function to obtain the posterior distribution of the model parameters.
5. Interpret Results
Summarize and interpret the posterior distribution, which represents the updated knowledge about the model parameters after considering the observed data.
6. Conduct Sensitivity Analyses
Assess the robustness of the results by examining how changes in the prior distributions or model assumptions affect the posterior distribution.
For researchers or health professionals, Bayesian methods offer a flexible way to understand epidemiological data better. Journals like Biometrics and Biostatistics focus on these techniques for health studies. They show how useful Bayesian methods are for dealing with complex data and uncertainty.
Common Bayesian Analysis Concepts
| Concept | Description | Example |
|---|---|---|
| Bayes’ Theorem | Fundamental theorem for updating probabilities based on new evidence. | Updating the probability of lung cancer given smoking status. |
| Prior Distribution | The initial belief about a parameter before observing data. | Prior distribution of infection rate based on historical data. |
| Likelihood Function | The probability of the observed data given a parameter. | Probability of observing flu cases given the infection rate. |
| Posterior Distribution | Updated belief about a parameter after observing data. | Updated probability of infection rate after considering current data. |
| Markov Chain Monte Carlo (MCMC) | Computational method to sample from posterior distribution. | Generating samples to estimate the posterior distribution. |
| Credible Interval | Range within which a parameter lies with a certain probability. | 95% credible interval for infection rate. |
| Conjugate Prior | A prior that, when combined with a likelihood, results in a posterior distribution of the same family. | Beta prior combined with binomial likelihood. |
| Posterior Predictive Distribution | Distribution of possible unobserved values conditional on the observed data. | Predicting future flu cases based on the current model. |
| Marginal Likelihood | The probability of the observed data under the model. | Calculating the evidence for model comparison. |
| Hyperparameters | Parameters of the prior distribution. | Mean and variance of the prior distribution. |
| Model Evidence | Quantifies how well the model explains the data. | Used for comparing different models. |
| Posterior Mean | The mean of the posterior distribution. | Average estimated infection rate after analysis. |
| Posterior Mode | The mode of the posterior distribution. | Most likely value of infection rate after analysis. |
| Posterior Median | The median of the posterior distribution. | Median estimated infection rate after analysis. |
Common Bayesian Analysis Formulas
Bayes’ Theorem:
P(A|B) = [P(B|A) × P(A)] / P(B)
P(A|B): Posterior probability of event A given event B
P(B|A): Likelihood of event B given event A
P(A): Prior probability of event A
P(B): Marginal probability of event B
Posterior Distribution:
P(θ|X) ∝ P(X|θ) × P(θ)
P(θ|X): Posterior distribution of parameter θ given data X
P(X|θ): Likelihood function of data X given parameter θ
P(θ): Prior distribution of parameter θ
Marginal Likelihood:
P(X) = ∫ P(X|θ) × P(θ) dθ
P(X): Marginal likelihood of data X
P(X|θ): Likelihood function of data X given parameter θ
P(θ): Prior distribution of parameter θ
Posterior Mean:
E(θ|X) = ∫ θ × P(θ|X) dθ
E(θ|X): Posterior mean of parameter θ given data X
P(θ|X): Posterior distribution of parameter θ given data X
Posterior Variance:
Var(θ|X) = ∫ [θ – E(θ|X)]^2 × P(θ|X) dθ
Var(θ|X): Posterior variance of parameter θ given data X
E(θ|X): Posterior mean of parameter θ given data X
P(θ|X): Posterior distribution of parameter θ given data X
Credible Interval:
P(a ≤ θ ≤ b|X) = ∫_a^b P(θ|X) dθ
P(a ≤ θ ≤ b|X): Probability that parameter θ lies between a and b given data X
P(θ|X): Posterior distribution of parameter θ given data X
Bayes Factor:
BF = P(X|H1) / P(X|H0)
BF: Bayes factor
P(X|H1): Marginal likelihood of data X under hypothesis H1
P(X|H0): Marginal likelihood of data X under hypothesis H0
These formulas are fundamental to Bayesian analysis and are used to update beliefs about parameters or hypotheses based on observed data. Bayes’ Theorem forms the foundation of Bayesian inference, allowing us to combine prior knowledge with the likelihood of the data to obtain the posterior distribution. The posterior distribution summarizes our updated beliefs about the parameters after considering the data.
Marginal likelihood, posterior mean, posterior variance, and credible intervals are derived from the posterior distribution and provide summary measures and uncertainty quantification. Bayes factors are used for model comparison and hypothesis testing in a Bayesian framework.
It’s important to note that the specific formulas and notations may vary depending on the context and the specific Bayesian model being used.

Bayesian Analysis of Lung Cancer Risk Factors: A Case Study
Using a hypothetical dataset, we’ll walk through the process step by step, showcasing the power and flexibility of this approach. Join us as we uncover valuable insights that can inform public health efforts.
🔍 Highlight: Bayesian methods allow us to incorporate prior knowledge and uncertainty into our analysis, providing a more comprehensive understanding of lung cancer risk factors.
The Data
Imagine we have data on 1,000 individuals, including their age, smoking status, family history of lung cancer, and whether they have been diagnosed with lung cancer. Here’s a glimpse of what the dataset might look like:
| ID | Age | Smoking Status | Family History | Lung Cancer |
|---|---|---|---|---|
| 1 | 45 | 1 | 0 | 0 |
| 2 | 52 | 0 | 1 | 0 |
| 3 | 68 | 1 | 1 | 1 |
| … | … | … | … | … |
| 1000 | 37 | 0 | 0 | 0 |
Note: Smoking Status (1 = smoker, 0 = non-smoker), Family History (1 = positive, 0 = negative), Lung Cancer (1 = diagnosed, 0 = not diagnosed)
Step 1: Incorporating Prior Knowledge
To start our Bayesian analysis, we specify prior distributions for the model parameters based on previous studies and expert opinion. These prior distributions allow us to incorporate existing knowledge into our model.
“The prior distribution is the key to Bayesian inference, as it allows us to quantify our initial beliefs about the parameters before observing the data.” – Andrew Gelman, statistician
🎯 Tip: When specifying prior distributions, it’s essential to carefully consider the available information and consult with subject matter experts to ensure the priors are informative and reasonable.
Step 2: Collecting the Data
With our prior distributions set, we move on to the data collection stage. In this case study, we have the dataset ready to be analyzed.
Step 3: Building the Likelihood Function
Next, we create a logistic regression model to represent the likelihood of an individual having lung cancer based on their age, smoking status, and family history. This model connects our data to the parameters we want to estimate.
🔍 Highlight: The likelihood function is a crucial component of Bayesian analysis, as it quantifies the probability of observing the data given the model parameters.
Step 4: Calculating the Posterior Distribution
Using Bayes’ theorem and Markov Chain Monte Carlo (MCMC) methods, we combine the prior distributions with the likelihood function to calculate the posterior distribution of the model parameters. This distribution provides insights into the relationships between the risk factors and lung cancer.
⚠️ Caution: MCMC methods can be computationally intensive, especially for large datasets or complex models. It’s important to monitor convergence and ensure that the MCMC algorithm has explored the parameter space adequately.
Step 5: Interpreting the Results
After running the MCMC algorithm, we obtain the posterior means and 95% credible intervals for the model parameters. These results help us understand the associations between age, smoking status, family history, and lung cancer risk.
🎯 Tip: When interpreting the results, focus on the posterior means and credible intervals, which provide a range of plausible values for the parameters given the data and prior knowledge.
Step 6: Checking the Robustness of Results
To ensure our results are reliable, we conduct sensitivity analyses by varying the prior distributions or considering alternative model specifications. This step allows us to assess how different assumptions might affect our findings.
“Sensitivity analysis is an essential part of any Bayesian analysis, as it helps to assess the robustness of the conclusions to the choice of prior distributions and model assumptions.” – David Spiegelhalter, statistician
By following these steps, we can leverage Bayesian methods to gain deeper insights into lung cancer risk factors. This approach not only allows us to incorporate prior knowledge but also provides a flexible framework for handling uncertainty and complexity in epidemiological studies.
Key Takeaways
- Bayesian methods handle complex data structures and multiple uncertainties effectively.
- Modern Bayesian computational techniques, like Markov chain Monte Carlo, offer significant flexibility.
- Bayesian techniques are essential for decision-theoretic analysis in health research.
- Despite their benefits, many studies fail to report crucial aspects like sensitivity analysis and convergence diagnostics.
- Bayesian methods are used extensively in areas like meta-analysis, survival analysis, and spatial analysis in epidemiology.
- Enhanced reporting and transparency in Bayesian analysis are needed for more reliable health research outcomes.
Understanding Bayesian Methods in Epidemiology
Bayesian methods are a powerful tool for tackling complex problems in epidemiology. They blend prior knowledge with new data for a deeper understanding of research findings. This section explores the basics, history, and current use of Bayesian inference in health research.
The Basics of Bayesian Methods
Bayesian methods update beliefs with new evidence. In health research, they use statistical techniques. Prior distributions show what we already know, and the likelihood function shows data probability. This mix updates the posterior distribution, giving better estimates.
These methods are flexible and easy to understand. They provide direct probability statements, considering the natural variability in predictions. By using prior knowledge, researchers can make better decisions, focusing on specific patient groups or policy needs.
Historical Context
Until the 1920s, Bayesian methods were widely used alongside other techniques. But then, frequentist approaches took over. For over 50 years, frequentist methods were more popular in advanced statistical research.
In the late 20th century, Bayesian methods made a comeback, especially in health and medical research. A key moment was when Bayesian methods were recognized in health technology assessments. From 1990 to 1998, over 4,000 papers mentioned “Bayesian,” many focusing on health technology assessment.
Relevance in Modern Epidemiology
Today, Bayesian methods are key in advanced epidemiology training and studies. They are used in various study designs, like case-control and cohort studies. Their flexibility and detailed outputs are crucial for health researchers.
Bayesian approaches in clinical trials are praised for their ethical flexibility. They allow for interim analyses and adjustments as data comes in. Modern epidemiological research often uses Bayesian inference to combine evidence from different sources.
This method’s ability to blend prior knowledge with new data ensures strong and adaptable models. These are vital for accurate health predictions and interventions. Despite some challenges, Bayesian methods are a crucial part of epidemiological modeling and health research.
Bayesian Point of View in Statistical Inference
Statistical inference is about making conclusions from sample data. The Bayesian view offers a special way to do this. The term “Bayesian” started to be used in the mid-20th century. Bayes’ Theorem was first proposed in 1763. Now, Bayesian methods are key in many areas, like public health and computer science.
Bayes’ Theorem and Its Applications
Bayes’ Theorem is the base of Bayesian analysis. It updates old beliefs with new data to make new predictions. This is very useful in public health, where predictions need to change often.
For example, if you start with a guess about a rare disease, adding new data can make your guess more accurate. You might go from a Beta (2; 20) to a Beta (2; 40) distribution.
Conditional Probability in Epidemiology
Conditional Probability is key in Bayesian analysis, especially in studying health. It lets you figure out the chances of health outcomes with new data. This method is more flexible and gives deeper insights than older methods.
Frequentist vs. Bayesian Approaches
The debate between Bayesian and Frequentist statistics is still going. Each has its own strengths. Frequentist analysis gives point estimates and confidence intervals but doesn’t use prior knowledge.
Bayesian methods, on the other hand, use prior knowledge and give posterior means and intervals. They don’t need big sample sizes. This makes them great for combining public health data. Bayesian intervals are easier to understand because they state probabilities directly.
In the end, both Bayesian and Frequentist methods have their good points. But Bayesian analysis is often better because it uses prior knowledge in estimation.
Bayesian Methods in Epidemiology: An Introduction to Probabilistic Reasoning
Bayesian analysis and epidemiology together give us deep insights into how diseases spread and how we can fight them. Since the 1930s, we’ve moved from fixed to random models. This change has changed how we see disease spread and predict outbreaks.
Key Concepts
Bayesian methods in epidemiology rely on several important ideas:
- Bayesian Networks: These networks help in making predictions in medicine, weather, and tracking diseases. They update our beliefs based on new information, which is key to testing hypotheses.
- SIR Model Basics: Models like SIR help us understand how diseases spread and fade away. Adding Bayesian learning to these models helps us deal with the unknowns in different places and populations.
The Black Death in the 14th century shows how Bayesian methods could have helped us understand and stop its spread.
Common Misconceptions
Despite its strengths, Bayesian analysis can be misunderstood. Here are some common mistakes:
- Subjective Probability Misunderstanding: Bayesian methods use a personal view of probability, showing our own uncertainty, not the true chance of an event.
- Complexity Overestimation: Bayesian methods might seem hard because of their math, but they really give clear insights into how we should update our beliefs with new facts. This is key in understanding disease spread.
Events like the 1918 flu, which killed 20 million people, show why we need strong models for health decisions. Using Bayes’ theorem, we can update our guesses based on new evidence. This leads to better health strategies.
| Historical Event | Impact | Relevance to Bayesian Methods |
|---|---|---|
| Black Death (14th Century) | 25% of Europe’s population lost | Could provide insights into rapid spread and mitigation strategies |
| Smallpox (1521) | Half of Aztec population affected | Assist in understanding pathogen’s spread through Bayesian networks |
| 1918 Influenza Pandemic | 20 million fatalities within a year | Highlights the need for ongoing updates to models with new data |
Understanding Bayesian analysis and its core ideas helps us use it better in fighting diseases. This is vital for dealing with health crises like the fast spread of the 2003 SARS outbreak.
Study Designs and Bayesian Analysis
In epidemiology, study designs are key to checking health technologies and how accurate tests are. Using Bayesian analysis boosts the power of these studies. This includes tests, case-control studies, and cohort studies.
Diagnostic Tests and Bayesian Analysis
Knowing how Bayesian diagnostic test accuracy works is vital for making medical decisions. Bayesian methods help figure out the chance a patient has a disease if a test comes back positive. The starting guess, or prior distribution, gets updated with new info to make a better diagnosis.
Pocock and Spiegelhalter found a trial that showed early treatment cut mortality by 49%. Their Bayesian analysis showed how to improve decision-making with prior and likelihood curves.
Case-Control and Cohort Studies
Case-control study analysis and cohort study predictive modeling get better with Bayesian methods. In case-control studies, prior knowledge about disease and exposure can be added to the analysis. This makes the odds ratios more precise. Cohort studies can also use Bayesian modeling to forecast disease based on exposure, adapting to new evidence over time.
A search found almost 4000 papers on using Bayesian methods in health tech assessment from 1990-1998. About 200 were about health tech assessment, and about 30 took a fully Bayesian view. This shows Bayesian methods’ potential in epidemiology, even if they’re not widely used.
For more on the importance of causal inference in epidemiology and public health, check out our detailed resource.
Prior and Posterior Distributions in Bayesian Analysis
Bayesian analysis is a deep way to update our beliefs with new evidence. It’s all about how prior and posterior distributions work together. This is key to Bayesian updating in fields like epidemiology.
Understanding Prior Distributions
A prior distribution shows what we think about a parameter at first, before any new info. For example, we might think a woman is very unlikely to carry a gene for hemophilia. But, if her brother has hemophilia, we quickly change our mind to 50%. This first guess, the “prior” probability, is vital for later analysis.
Posterior Distributions in Practice
Using posterior distributions means updating our prior with new evidence. If the woman has two sons without hemophilia, the chance she’s a carrier drops to 1/4. So, knowing her sons are healthy lowers the carrier probability from 50% to 20%.
Updating Beliefs with Bayesian Methods
Bayesian updating helps us get better at handling uncertainty. As we get more data, our beliefs change to be more accurate. For instance, knowing the woman’s sons are healthy cuts down the uncertainty about her gene from 50% to 20%.
This approach isn’t just for individuals. It helps us make better decisions at a population level in fields like medicine and public health.
| Probability Scenario | Initial Estimation | Updated Estimation |
|---|---|---|
| Carrier probability (prior) | 1/2 | 20% |
| Survival probability at 3 years (clinical trials) | 30% | 50% |
Markov Chain Monte Carlo Techniques
Bayesian computational algorithms are key in today’s statistical analysis, especially in epidemiology. Markov Chain Monte Carlo (MCMC) is a set of techniques for finding the posterior distribution of model parameters. It’s great because it avoids the hard part of Bayes’ theorem, P(data), by generating samples from a Markov chain that gets close to the posterior distribution.

One big plus of Markov Chain Monte Carlo methods is how they tackle complex integrals. These are key in Bayesian statistics. The Metropolis-Hastings algorithm helps build these chains, which move around a distribution that gets closer to the posterior distribution. This makes MCMC a must-have in MCMC epidemiology, where getting parameters right is crucial.
To keep MCMC working well, you need to set some parameters right. These include the number of chains, the warmup phase length, and the sampling phase length. The warmup phase gets the chain to a stable state, and then the sampling phase gives you data to analyze. Experts suggest running at least three chains with different starts to check for convergence and lower variance.
For you, knowing how to set these parameters is key. Start with simple models and add complexity to figure out and fix any issues with Markov chains. Tools like Stan and PyMC make it easier to use MCMC for different statistical problems, including those in epidemiology.
Checking how well MCMC algorithms work involves looking at things like Monte Carlo Standard Error (MCSE) and Effective Sample Size (ESS). Make sure your estimates are precise enough. Use trace and density plots to see if your estimates agree well across chains. This helps you know if your MCMC studies are reliable.
In short, getting good at Markov Chain Monte Carlo in public health means knowing the theory and getting practical experience. With the right skills, MCMC can give you accurate and efficient results. It’s a key part of Bayesian computational algorithms today.
Hierarchical Models in Bayesian Epidemiology
In Bayesian epidemiology, hierarchical models are key for tackling complex data. They work well with nested data found in public health studies. These models help us understand risk factors for diseases like heart disease or cancer.
Applications of Hierarchical Models
Hierarchical models are used a lot in epidemiology. For example, Bayesian networks are used in many areas, including clinical decision support and disease research. They help predict outcomes by looking at risk factors from different levels.
In heart disease research, models like the Framingham score and Heart Age score are used. They help figure out how individual risk factors add up. The World Health Organization says controlling risk factors like smoking could prevent a lot of heart disease and diabetes.
Advantages Over Traditional Methods
Hierarchical models are great at handling complex data. Traditional methods often can’t deal with this kind of data. These models assume a normal distribution for random effects, which helps with complex interactions.
Markov chain Monte Carlo (MCMC) methods have made these models even better. They let researchers work with complex data and find outliers. This is important in public health, where finding unusual patterns can help make better policies.
Overall, hierarchical models in Bayesian epidemiology give us a deep look at disease causes. They help make predictions more accurate in public health research.
Regression Methods and Bayesian Adjustments
In epidemiology, understanding how risk factors and diseases are linked is key. Bayesian methods are great for this. They help fix biases in old methods, making regression analysis more accurate and reliable.
Logistic and Linear Regression
Bayesian logistic regression is a powerful tool for handling data with few cases. It uses prior knowledge and gives a clear view of the results. This helps avoid overestimating or underestimating risks.
Linear regression adjustments in Bayesian analysis are also useful. They let researchers add prior knowledge, especially when dealing with complex data. Studies show that Bayesian linear models work well for adjusting for variables, making results more accurate.
Nonlinear Models and Bayesian Analysis
Bayesian methods are also great for complex, real-world scenarios. Nonlinear epidemiological models can capture complex interactions between variables. By using Bayesian methods, researchers can better understand how diseases spread, as seen in a study on diarrhea in Cameroon.
For better nonlinear epidemiological modeling, Bayesian methods add features like hierarchical random effects. This helps epidemiologists understand how interventions affect public health more accurately.
Bayesian methods have also seen new advances, like penalization techniques. These reduce biases in logistic and other regressions. Such findings are crucial for public health policies, showing the importance of Bayesian methods in epidemiology.
“By using Bayesian methods, you can fix biases and improve convergence issues in traditional models. This leads to more reliable insights in epidemiology.”
Here’s a table that compares traditional and Bayesian regression methods:
| Method | Traditional Approach | Bayesian Approach |
|---|---|---|
| Logistic Regression | Bias due to sparse data | Mitigates sparse data bias using priors |
| Linear Regression | Fixed coefficients | Incorporates prior distributions |
| Nonlinear Models | Limited flexibility | Handles complex interactions |
Bayesian Life Tables and Survival Analysis
Bayesian methods bring big benefits to epidemiology, especially in survival analysis and life tables. They give researchers strong tools to figure out survival rates and track health state changes.

Life tables are key in this field, giving detailed health measures for populations. The book “Bayesian Methods in Epidemiology: An Introduction” dives deep into these methods. It covers models like the Weibull distribution and the Cox proportional hazards model. These tools help estimate survival rates with precision, tackling the complex data in epidemiology.
Estimating Survival Rates
Bayesian survival analysis gives more precise and flexible survival rate estimates by using prior info and data. The book shows many models, both parametric and nonparametric, helping epidemiologists. A big plus of Bayesian methods is how they handle uncertainty well. This is key when figuring out survival rates for different groups of people.
Application of the Weibull Distribution
The Weibull distribution is great for modeling survival data because it’s flexible. It can match various hazard functions. This flexibility lets researchers create models that fit their needs, giving more accurate predictions. Adding the Weibull distribution to Bayesian survival analysis makes life tables estimation stronger. It’s a top choice for statisticians and epidemiologists.
Cox Proportional Hazards Model
The Cox proportional hazards model is a go-to for survival analysis. Bayesian methods take this model further by adding prior distributions. This leads to deeper and more insightful studies. The model is key in seeing how different factors affect survival times. This helps in making better health decisions. For more on Bayesian survival analysis, check out this article.
The table below gives a quick look at the main points from “Bayesian Methods in Epidemiology: An Introduction”. It looks at different models and their uses.
| Model | Feature | Application |
|---|---|---|
| Weibull Distribution | Flexible Hazard Functions | Life Tables Estimation |
| Cox Proportional Hazards Model | Nonparametric Approach | Survival Analysis |
| Bayesian Kaplan-Meier | Visualization of Survival Functions | Univariate Analysis |
Bayesian Approaches in Disease Surveillance
Bayesian methods are key in disease surveillance, offering strong ways to track outbreaks and spot unusual patterns. They help improve health responses by modeling parameters with probabilities and showing the uncertainty. A big study looked at 3,225 documents to see how Bayesian methods help in health and animal surveillance. This shows how important Bayesian methods are for tracking outbreaks and finding anomalies in health.
Monitoring Outbreaks
Bayesian methods are great for watching outbreaks closely. For instance, studies made models using data from France and Norway. The Bayesian framework includes different models, each helping to predict and manage outbreaks. These methods are better for making decisions because they use probabilities and include prior knowledge and data.
Anomaly Detection
Bayesian methods are also top-notch at finding unusual patterns, which is key for early warnings. The Bayes factor is a big part of this, giving a ratio of the odds of an outbreak versus other possibilities. This makes it easier and faster to respond to health threats. But, setting prior probabilities and the complexity of full Bayesian methods are challenges. Still, Bayesian methods are great at combining different data and modeling uncertain parameters, keeping people safe.
Bayesian approaches are playing a big role in modern health tracking. They help with monitoring outbreaks and finding unusual patterns in health. By using new spatial statistical methods and GIS, we can make disease surveillance better and more reliable. This could lead to better health outcomes.
FAQ
What are Bayesian statistical methods and why are they important in epidemiology?
Bayesian statistical methods use probabilities to test hypotheses. They’re key in epidemiology for mixing what we already know with new data. This makes modeling public health data more precise and flexible.
How can Bayesian methods be applied in the analysis of diagnostic tests?
Bayesian methods improve how we judge diagnostic tests by updating what we know with new data. This leads to better estimates of how accurate tests are. It makes diagnosing diseases more reliable in public health.
What is the significance of Bayes’ Theorem in epidemiological modeling?
Bayes’ Theorem is crucial in modeling diseases because it lets us update our knowledge with new data. This helps in making better decisions and assessing risks in public health studies.
Why is conditional probability essential in Bayesian analysis?
Conditional probability is key in Bayesian analysis. It helps us update the chances of an event with new evidence. This sharpens our predictions and improves our understanding of disease data.
How do Bayesian methods compare to frequentist approaches in epidemiology?
Bayesian methods are different from frequentist methods. They give us probability statements about parameters and use prior knowledge. This offers a more detailed and adaptable way to analyze data in epidemiology.
What are prior and posterior distributions in Bayesian analysis?
Prior distributions show what we believe about a parameter before looking at new data. Posterior distributions update these beliefs after we see new evidence. Together, they are the heart of Bayesian inference.
How are Markov Chain Monte Carlo techniques used in Bayesian epidemiological analysis?
Markov Chain Monte Carlo (MCMC) methods are algorithms that help estimate posterior distributions. They’re useful when solving complex problems, making Bayesian analysis more accurate and practical in epidemiology.
What advantages do hierarchical models offer in Bayesian epidemiology?
Hierarchical models let us analyze data at different levels and handle various types of variability. They model complex relationships well, giving us more precise and detailed insights into public health research.
How are Bayesian methods applied in disease surveillance and outbreak investigation?
Bayesian methods help track outbreaks by updating the chance of disease based on new data. This speeds up detection and response to health threats. They also spot unusual patterns that might signal new outbreaks.
What are some key concepts and common misconceptions about Bayesian analysis in epidemiology?
Important ideas in Bayesian analysis include using probabilities, prior and posterior distributions, and conditional probabilities. Misunderstandings often come from not grasping the role of subjective priors and the difference between Bayesian and frequentist views on probability.
Source Links
- https://www.sciencedirect.com/science/article/abs/pii/S0169716105250265 – Innovative Bayesian Methods for Biostatistics and Epidemiology
- https://www.nature.com/articles/s41562-021-01177-7 – Bayesian Analysis Reporting Guidelines – Nature Human Behaviour
- https://academic.oup.com/ije/article/35/3/765/735529 – Bayesian perspectives for epidemiological research: I. Foundations and basic methods
- https://www.ncbi.nlm.nih.gov/pmc/articles/PMC1116393/ – Methods in health service research: An introduction to bayesian methods in health technology assessment
- https://projecteuclid.org/journals/bayesian-analysis/volume-1/issue-1/When-did-Bayesian-inference-become-Bayesian/10.1214/06-BA101.pdf – PDF
- https://hbiostat.org/bayes/bet/resources.html – Introduction to Bayes for Evaluating Treatments – 13 Resources
- https://www.stata.com/manuals/bayesintro.pdf – PDF
- https://researchonline.lshtm.ac.uk/4661437/13/computational_epidemiology_bayesian_disease_surveillance_accepted_version (1).pdf – PDF
- http://www.medicine.mcgill.ca/epidemiology/hanley/bios601/ch10Bayes/an overview of the Bayesian approach.pdf – “An Overview of the Bayesian Approach”. In: Bayesian Approaches to Clinical Trials and Health-Care Evaluation
- https://biostat.app.vumc.org/wiki/pub/Main/ClinStat/bayes.pdf – C:\doc\Talks\dia97\bayes.DVI
- http://www.medicine.mcgill.ca/epidemiology/joseph/courses/epib-669/hornberger2001.pdf – INTRODUCTION TO BAYESIAN REASONING
- https://storopoli.io/Bayesian-Julia/pages/05_MCMC/ – Markov Chain Monte Carlo (MCMC)
- https://stat.columbia.edu/~gelman/research/published/2311.02726.pdf – PDF
- https://people.eecs.berkeley.edu/~russell/papers/uai06-blog.pdf – PDF
- https://www.sciencedirect.com/science/article/abs/pii/S0169260715301140 – Bayesian network modeling: A case study of an epidemiologic system analysis of cardiovascular risk
- https://projecteuclid.org/journals/bayesian-analysis/volume-2/issue-2/Identifying-outliers-in-Bayesian-hierarchical-models–a-simulation-based/10.1214/07-BA218.pdf – PDF
- https://www.ncbi.nlm.nih.gov/pmc/articles/PMC4864881/ – Outcome modelling strategies in epidemiology: traditional methods and basic alternatives
- https://www.e-epih.org/upload/pdf/epih-33-e2011006.pdf – PDF
- https://www.ebay.com/p/117271917 – Chapman and Hall/CRC Biostatistics Ser.: Bayesian Methods in Epidemiology by Lyle D. Broemeling (2013, Hardcover) for sale online | eBay
- https://www.amazon.co.jp/-/en/Lyle-D-Broemeling/dp/0367576341 – Amazon.co.jp: Bayesian Methods in Epidemiology (Chapman & Hall/CRC Biostatistics Series) : Broemeling, Lyle D.: Foreign Language Books
- https://www.ebay.com/itm/354681559578 – Bayesian Methods in Epidemiology (C…, Broemeling, Lyl 9781466564978 | eBay
- https://www.openagrar.de/servlets/MCRFileNodeServlet/openagrar_derivate_00046008/SD2022195_Preprint.pdf – PDF
- https://zenodo.org/record/6548556 – Bayesian approaches to epidemiological surveillance: a review and introduction for risk-assessors and decision-makers.